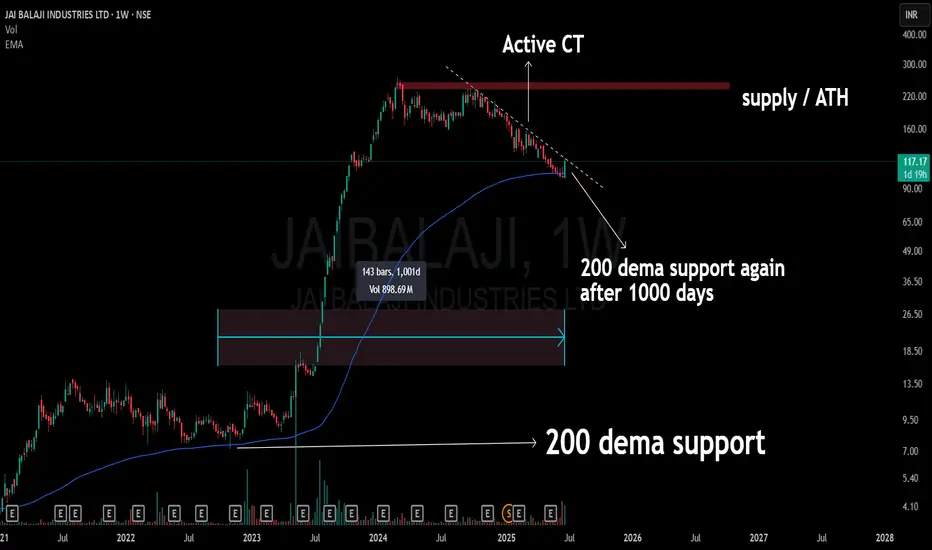
🔵 Stock: JAI BALAJI (Weekly)
🔥 Support Revisit: Back to the 200 DEMA after 1000 days
A level that once acted as the launchpad.
Current structure shows an active compression trend (CT) right into this long-term dynamic support.
The chart also aligns below a major supply zone / ATH band, keeping the broader context in check.
📉 No prediction. No call. Just structure, levels, and time-tested zones doing the talking.
🎯 Master My Self-Made Trading Strategy
📈 Telegram (Learn Today): t.me/hashtaghammer
✅ WhatsApp (Learn Today): wa.me/919455664601
📈 Telegram (Learn Today): t.me/hashtaghammer
✅ WhatsApp (Learn Today): wa.me/919455664601
Bài đăng liên quan
Thông báo miễn trừ trách nhiệm
Thông tin và các ấn phẩm này không nhằm mục đích, và không cấu thành, lời khuyên hoặc khuyến nghị về tài chính, đầu tư, giao dịch hay các loại khác do TradingView cung cấp hoặc xác nhận. Đọc thêm tại Điều khoản Sử dụng.