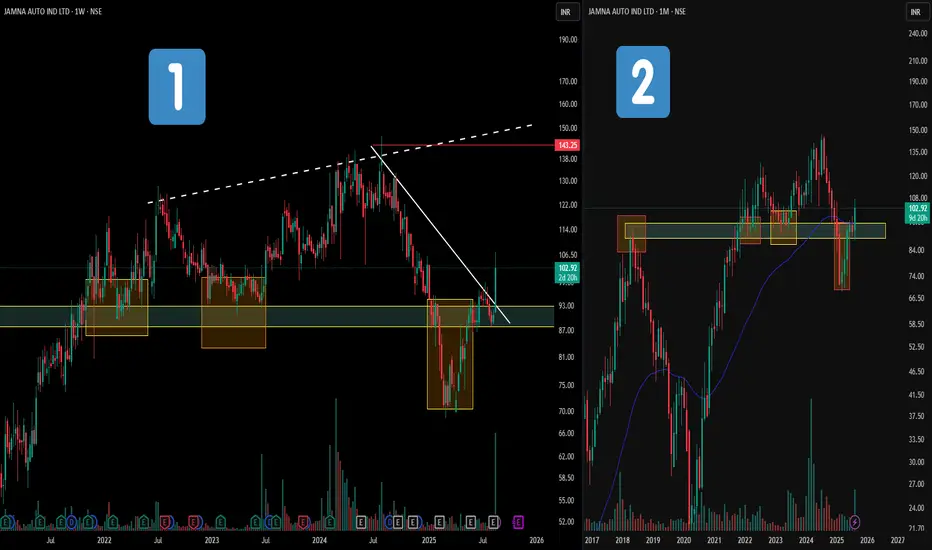
🔹 Left Side (Weekly Timeframe - WTF)
-The white downward line marks the counter-trendline (CT) break, showing the first sign of momentum shift.
-The dashed white upper line connects the higher highs, forming part of a broadening structure.
-Strong volumes when price moves up and drop in volumes when price goes sideways shows that there is no volume price divergence
🔹 Right Side (Monthly Timeframe - MTF)
-The orange boxes highlight historical supply-demand confluence points where the stock has repeatedly reacted.
-The larger yellow zone represents the major demand zone, which price has respected and consolidated above.
-Price action shows a clear conversion from supply → demand.
🎯 Master My Self-Made Trading Strategy
📈 Telegram (Learn Today): t.me/hashtaghammer
✅ WhatsApp (Learn Today): wa.me/919455664601
📈 Telegram (Learn Today): t.me/hashtaghammer
✅ WhatsApp (Learn Today): wa.me/919455664601
Bài đăng liên quan
Thông báo miễn trừ trách nhiệm
Thông tin và ấn phẩm không có nghĩa là và không cấu thành, tài chính, đầu tư, kinh doanh, hoặc các loại lời khuyên hoặc khuyến nghị khác được cung cấp hoặc xác nhận bởi TradingView. Đọc thêm trong Điều khoản sử dụng.