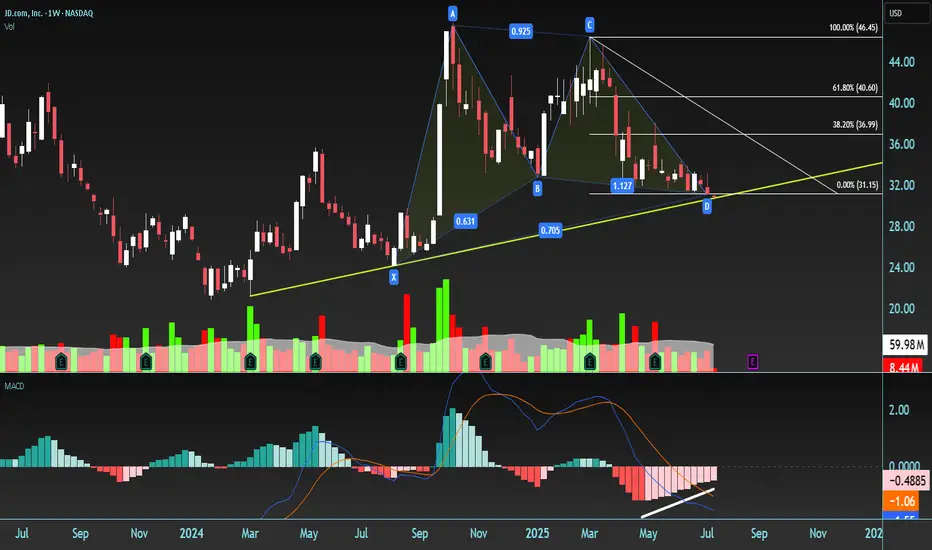
Potential Bullish Gartley pattern has formed with the following structure: XABCD.
initial low X = 23.45 , Price rallies to point A, then forms a corrective structure down to
D = 30.71 trough BCD. CD leg is downward, completing the pattern.
Despite the decline, point D is higher than X, suggesting a bullish setup. The area around D (30.71) is identified as a Potential Reversal Zone (PRZ).
Confluences Supporting a Long Entry
1. Gartley Completion at PRZ
Point D lies near the 78.6% Fibonacci retracement of the XA leg — a typical Gartley completion level.
2. Rising Support Trend Line
D is aligned with a yellow ascending trend line, reinforcing it as a potential bounce area.
3. MACD Bullish Divergence
Price makes a lower low into D, while MACD forms a higher low, signaling bullish momentum divergence.
Trade Plan
* Enter long after confirmation via a strong bullish candle*(e.g., bullish engulfing, hammer)
* Preferably accompanied by above-average volume
Stop Loss:
* Place stop just below point D (30.71)
* Allow a small buffer (e.g., 1–2% below) to account for noise
Targets – Fibonacci Retracement of CD Leg:
1. Target 1 – 38.2%
2. Target 2 – 61.8%
3. Target 3 – 78.6%
4. Target 4 – 100% (full retracement of CD)
Risk Management:
* Use appropriate position sizing (e.g., risk only 1–2% of total capital)
* Consider trailing the stop as targets are hit to lock in profits
Thông báo miễn trừ trách nhiệm
Thông tin và ấn phẩm không có nghĩa là và không cấu thành, tài chính, đầu tư, kinh doanh, hoặc các loại lời khuyên hoặc khuyến nghị khác được cung cấp hoặc xác nhận bởi TradingView. Đọc thêm trong Điều khoản sử dụng.
Thông báo miễn trừ trách nhiệm
Thông tin và ấn phẩm không có nghĩa là và không cấu thành, tài chính, đầu tư, kinh doanh, hoặc các loại lời khuyên hoặc khuyến nghị khác được cung cấp hoặc xác nhận bởi TradingView. Đọc thêm trong Điều khoản sử dụng.