1) Supply-Demand Conversion Zone Observation
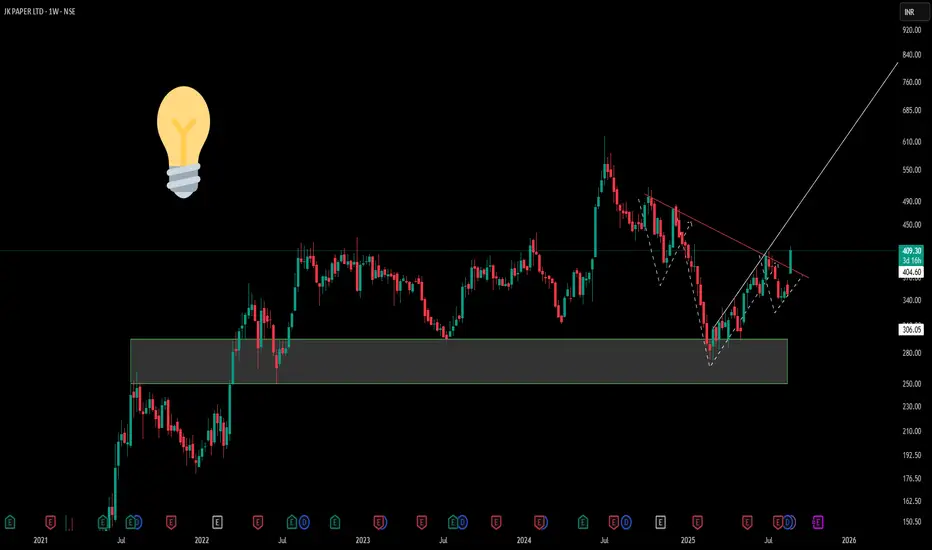
The highlighted grey rectangular zone on the chart represents a critical supply-demand conversion area. This zone, spanning approximately the ₹280-₹320 range, has historically acted as a significant inflection point where institutional money flow patterns have shifted.
2) The Inverted Head and Shoulders Formation
Above this conversion zone sits a textbook inverted head and shoulders pattern, meticulously marked with dotted lines. This formation showcases three distinct troughs:
-Left Shoulder: Formed during the initial decline phase
-Head: The deepest trough representing maximum bearish sentiment
-Right Shoulder: A higher low indicating weakening selling pressure
3) The pattern's neckline resistance (depicted by the red counter-trend line) : Its true nature is to provide resistance as a downward sloping trend continues up until trend shifts, also know as Market structure shift .
Disclaimer: This analysis is purely educational and structural in nature. It does not constitute investment advice, trading recommendations, or buy/sell signals. Always conduct your own research and consult with qualified financial advisors before making investment decisions.
🎯 Master My Self-Made Trading Strategy
📈 Telegram (Learn Today): t.me/hashtaghammer
✅ WhatsApp (Learn Today): wa.me/919455664601
📈 Telegram (Learn Today): t.me/hashtaghammer
✅ WhatsApp (Learn Today): wa.me/919455664601
Bài đăng liên quan
Thông báo miễn trừ trách nhiệm
Thông tin và ấn phẩm không có nghĩa là và không cấu thành, tài chính, đầu tư, kinh doanh, hoặc các loại lời khuyên hoặc khuyến nghị khác được cung cấp hoặc xác nhận bởi TradingView. Đọc thêm trong Điều khoản sử dụng.