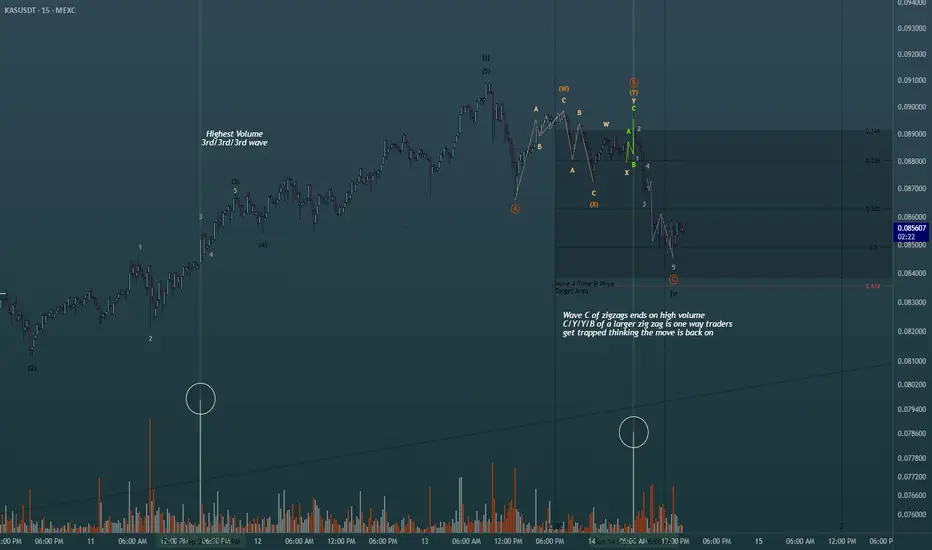
Shown on the chart is 2 of the ways you can use the highest volume spikes on the chart to find out where you are in the wave count. Easiest way is to find the highest volume with the steepest slope of trend to label as your third wave. Same concept whether its bearish bars printing or bullish bars. The highest volume shown is actually part of the retracement, albeit in one of the actionary waves (moving with trend), alot of buying happened at the termination of the wave C of the zig zag shown in green. Perfect scenario to rake in buy orders from retail then dump on them to finish out the WXY pattern. This is just 2 of the many scenarios in which you can find help from the volume oscillator to give you a directional bias in Elliott Waves. Happy Trading
Thông báo miễn trừ trách nhiệm
Thông tin và các ấn phẩm này không nhằm mục đích, và không cấu thành, lời khuyên hoặc khuyến nghị về tài chính, đầu tư, giao dịch hay các loại khác do TradingView cung cấp hoặc xác nhận. Đọc thêm tại Điều khoản Sử dụng.
Thông báo miễn trừ trách nhiệm
Thông tin và các ấn phẩm này không nhằm mục đích, và không cấu thành, lời khuyên hoặc khuyến nghị về tài chính, đầu tư, giao dịch hay các loại khác do TradingView cung cấp hoặc xác nhận. Đọc thêm tại Điều khoản Sử dụng.