📊 Current Price
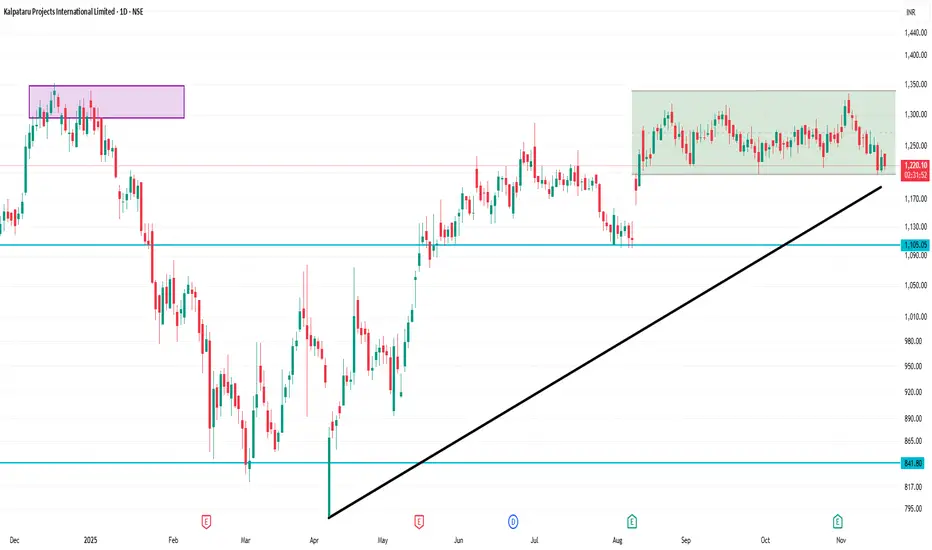
Last traded around ₹1,226.90 (as of about 11:58 AM IST on 20 Nov 2025) on NSE.
Day’s low ≈ ₹1,213.10, day’s high ≈ ₹1,239.30.
52-week range: Low ~ ₹786.30, High ~ ₹1,352.85.
✅ Interpretation & Notes
The stock is hovering near the ~₹1,225 level — which is near the 100-day MA, so it’s at a kind of technical crossroads.
With the price range for the day being relatively narrow (~₹1,213 to ~₹1,239), it suggests limited intraday volatility so far.
The gap between recent price and 52-week high (~₹1,352) indicates potential upside but that will depend on catalyst and momentum.
However, if the stock fails to hold above the ~₹1,200 support zone, it could drift toward weaker levels.
Bài đăng liên quan
Thông báo miễn trừ trách nhiệm
Thông tin và các ấn phẩm này không nhằm mục đích, và không cấu thành, lời khuyên hoặc khuyến nghị về tài chính, đầu tư, giao dịch hay các loại khác do TradingView cung cấp hoặc xác nhận. Đọc thêm tại Điều khoản Sử dụng.
Bài đăng liên quan
Thông báo miễn trừ trách nhiệm
Thông tin và các ấn phẩm này không nhằm mục đích, và không cấu thành, lời khuyên hoặc khuyến nghị về tài chính, đầu tư, giao dịch hay các loại khác do TradingView cung cấp hoặc xác nhận. Đọc thêm tại Điều khoản Sử dụng.