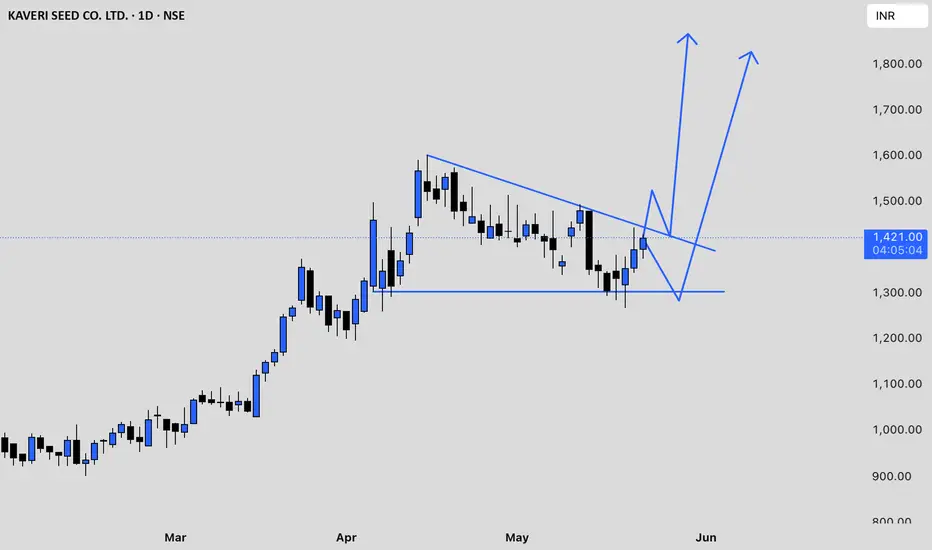
Kaveri Seed Company Ltd (KSCL) has recently experienced significant volatility. After reaching a peak above ₹1,480 in mid-May 2025, the stock corrected sharply, falling to the ₹1,305–₹1,345 range by May 16, marking a notable pullback of nearly 9% in a single session. Trading volumes have been high, indicating strong market participation during both the rally and the subsequent sell-off.
From a technical perspective, KSCL’s price remains above its 50-day, 100-day, and 200-day exponential moving averages, which suggests that the longer-term trend is still bullish. However, momentum indicators such as the Relative Strength Index (RSI) and Commodity Channel Index (CCI) are both in oversold territory, signaling that the recent correction may have been overdone and that a technical bounce could be possible if market sentiment improves. The Moving Average Convergence Divergence (MACD) is below its signal line, and the Average Directional Index (ADX) indicates the presence of a short-term downtrend.
Immediate support for KSCL is seen around ₹1,232, with further support at ₹1,174 and ₹1,116. On the upside, resistance is expected near ₹1,399, then at ₹1,457 and ₹1,515. The near-term pivot area is around ₹1,340–₹1,350.
Recent company developments—including the acquisition of a 30% stake in Aditya Agri Tech Pvt Ltd and the release of Q4 and FY25 results—may be influencing the current price action. The company has also been working to address challenges in receivables management, which could impact future performance.
In summary, KSCL is in a corrective phase after a strong rally, with oversold technical indicators suggesting potential for a short-term rebound if support holds. However, the short-term trend remains down, so traders should watch for stabilization above key support levels before considering new long positions. The longer-term outlook stays positive as long as the price remains above major moving averages, but caution is advised due to ongoing volatility and bearish momentum signals.
Thông báo miễn trừ trách nhiệm
Thông tin và các ấn phẩm này không nhằm mục đích, và không cấu thành, lời khuyên hoặc khuyến nghị về tài chính, đầu tư, giao dịch hay các loại khác do TradingView cung cấp hoặc xác nhận. Đọc thêm tại Điều khoản Sử dụng.
Thông báo miễn trừ trách nhiệm
Thông tin và các ấn phẩm này không nhằm mục đích, và không cấu thành, lời khuyên hoặc khuyến nghị về tài chính, đầu tư, giao dịch hay các loại khác do TradingView cung cấp hoặc xác nhận. Đọc thêm tại Điều khoản Sử dụng.