Latent View Analytics Ltd
About
Latent View Analytics Ltd provides analytics services such as data and analytics consulting, business analytics & insights, advanced predictive analytics, data engineering, and digital solutions. The company provides services to blue-chip companies in Technology, BFSI, CPG & Retail, Industrials, and other industry domains.
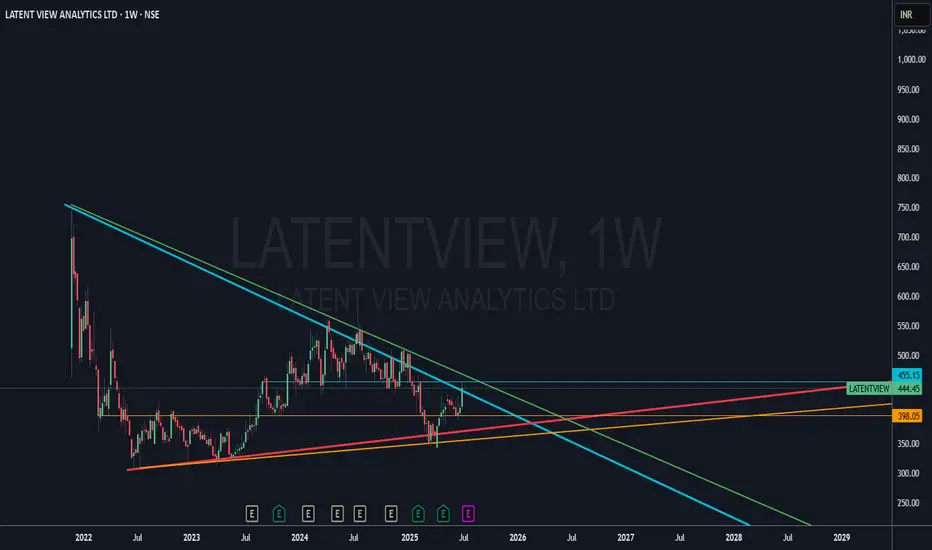
LatentView has shown a strong weekly bullish candle backed by volume and trendline breakout after long consolidation. If it manages to close above ₹450, it may confirm a multi-timeframe breakout.
📌 Key technical positives:
Bullish structure on both weekly and monthly charts
Strong bounce from long-term support
Momentum indicators turning up
Volumes supporting price action
📈 Eyes on the ₹491–₹561 zone as potential next resistance range.
🔎 Fundamentally, the company shows solid revenue and profit growth (28% 3Y sales CAGR), high ROE, debt-free status, and consistent promoter holding above 65%.
🧠 Disclaimer: For educational and research purposes only. No buy/sell advice.
📝 Chart Purpose & Disclaimer:
This chart is shared purely for educational and personal tracking purposes. I use this space to record my views and improve decision-making over time.
Investment Style:
All stocks posted are for long-term investment or minimum positional trades only. No intraday or speculative trades are intended.
⚠️ Disclaimer:
I am not a SEBI registered advisor. These are not buy/sell recommendations. Please consult a qualified financial advisor before taking any investment decision. I do not take responsibility for any profit or loss incurred based on this content.
About
Latent View Analytics Ltd provides analytics services such as data and analytics consulting, business analytics & insights, advanced predictive analytics, data engineering, and digital solutions. The company provides services to blue-chip companies in Technology, BFSI, CPG & Retail, Industrials, and other industry domains.
LatentView has shown a strong weekly bullish candle backed by volume and trendline breakout after long consolidation. If it manages to close above ₹450, it may confirm a multi-timeframe breakout.
📌 Key technical positives:
Bullish structure on both weekly and monthly charts
Strong bounce from long-term support
Momentum indicators turning up
Volumes supporting price action
📈 Eyes on the ₹491–₹561 zone as potential next resistance range.
🔎 Fundamentally, the company shows solid revenue and profit growth (28% 3Y sales CAGR), high ROE, debt-free status, and consistent promoter holding above 65%.
🧠 Disclaimer: For educational and research purposes only. No buy/sell advice.
📝 Chart Purpose & Disclaimer:
This chart is shared purely for educational and personal tracking purposes. I use this space to record my views and improve decision-making over time.
Investment Style:
All stocks posted are for long-term investment or minimum positional trades only. No intraday or speculative trades are intended.
⚠️ Disclaimer:
I am not a SEBI registered advisor. These are not buy/sell recommendations. Please consult a qualified financial advisor before taking any investment decision. I do not take responsibility for any profit or loss incurred based on this content.
Thông báo miễn trừ trách nhiệm
Thông tin và các ấn phẩm này không nhằm mục đích, và không cấu thành, lời khuyên hoặc khuyến nghị về tài chính, đầu tư, giao dịch hay các loại khác do TradingView cung cấp hoặc xác nhận. Đọc thêm tại Điều khoản Sử dụng.
Thông báo miễn trừ trách nhiệm
Thông tin và các ấn phẩm này không nhằm mục đích, và không cấu thành, lời khuyên hoặc khuyến nghị về tài chính, đầu tư, giao dịch hay các loại khác do TradingView cung cấp hoặc xác nhận. Đọc thêm tại Điều khoản Sử dụng.