1. Executive Summary
Laurus Labs is in a strong bullish momentum phase, trading well above its key Exponential Moving Average (EMA). The stock faces a decisive resistance at 950. A breakout above this level could signal the next leg up, while the trend remains supported on any pullback towards the 856-917 zone. The high RSI suggests caution for immediate entries; prefer buying on dips.
2. Key Technical Observations:
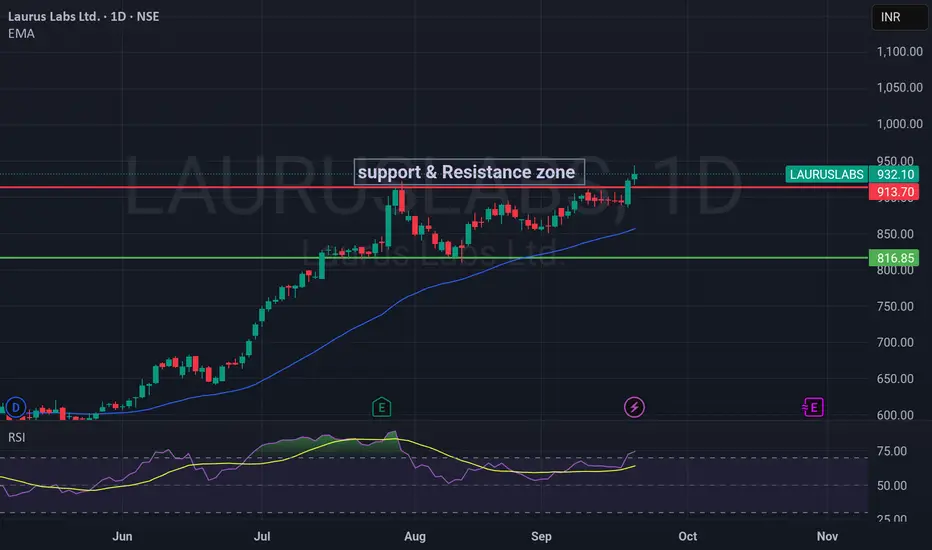
Price Action: The stock closed positively at 932.10 (+0.96%), near the day's high of 944, indicating strong buying interest at lower levels.
Trend Analysis: The price is trading significantly above the EMA (856.88), confirming a robust medium-term UPTREND.
Momentum (RSI): The RSI is at 74.73, indicating the stock is in OVERBOUGHT territory. This suggests the possibility of a short-term consolidation or pullback before the next potential move higher.
Key Levels:
Resistance: 950 (Immediate & Crucial)
Support: 917 (Today's Low) -> 856 (EMA & Strong Trend Support)
3. Trading Plan:
Bullish Scenario (Primary Bias):
Entry Trigger 1 (Aggressive): A breakout and sustained close above 950 with high volume.
Entry Trigger 2 (Conservative): A pullback towards the support zone between 917 - 870 (ideally near the 856 EMA) for a better risk-reward entry.
Stop-Loss: Below 850 (A break below the EMA would invalidate the bullish structure).
Target 1: 1000
Target 2: 1025 - 1050
Bearish Scenario (Caution Signal):
A break below the 856 EMA support could lead to a deeper correction towards 800.
This is not the primary expectation but a key level to watch for risk management.
Laurus Labs is in a strong bullish momentum phase, trading well above its key Exponential Moving Average (EMA). The stock faces a decisive resistance at 950. A breakout above this level could signal the next leg up, while the trend remains supported on any pullback towards the 856-917 zone. The high RSI suggests caution for immediate entries; prefer buying on dips.
2. Key Technical Observations:
Price Action: The stock closed positively at 932.10 (+0.96%), near the day's high of 944, indicating strong buying interest at lower levels.
Trend Analysis: The price is trading significantly above the EMA (856.88), confirming a robust medium-term UPTREND.
Momentum (RSI): The RSI is at 74.73, indicating the stock is in OVERBOUGHT territory. This suggests the possibility of a short-term consolidation or pullback before the next potential move higher.
Key Levels:
Resistance: 950 (Immediate & Crucial)
Support: 917 (Today's Low) -> 856 (EMA & Strong Trend Support)
3. Trading Plan:
Bullish Scenario (Primary Bias):
Entry Trigger 1 (Aggressive): A breakout and sustained close above 950 with high volume.
Entry Trigger 2 (Conservative): A pullback towards the support zone between 917 - 870 (ideally near the 856 EMA) for a better risk-reward entry.
Stop-Loss: Below 850 (A break below the EMA would invalidate the bullish structure).
Target 1: 1000
Target 2: 1025 - 1050
Bearish Scenario (Caution Signal):
A break below the 856 EMA support could lead to a deeper correction towards 800.
This is not the primary expectation but a key level to watch for risk management.
Thông báo miễn trừ trách nhiệm
Thông tin và ấn phẩm không có nghĩa là và không cấu thành, tài chính, đầu tư, kinh doanh, hoặc các loại lời khuyên hoặc khuyến nghị khác được cung cấp hoặc xác nhận bởi TradingView. Đọc thêm trong Điều khoản sử dụng.
Thông báo miễn trừ trách nhiệm
Thông tin và ấn phẩm không có nghĩa là và không cấu thành, tài chính, đầu tư, kinh doanh, hoặc các loại lời khuyên hoặc khuyến nghị khác được cung cấp hoặc xác nhận bởi TradingView. Đọc thêm trong Điều khoản sử dụng.