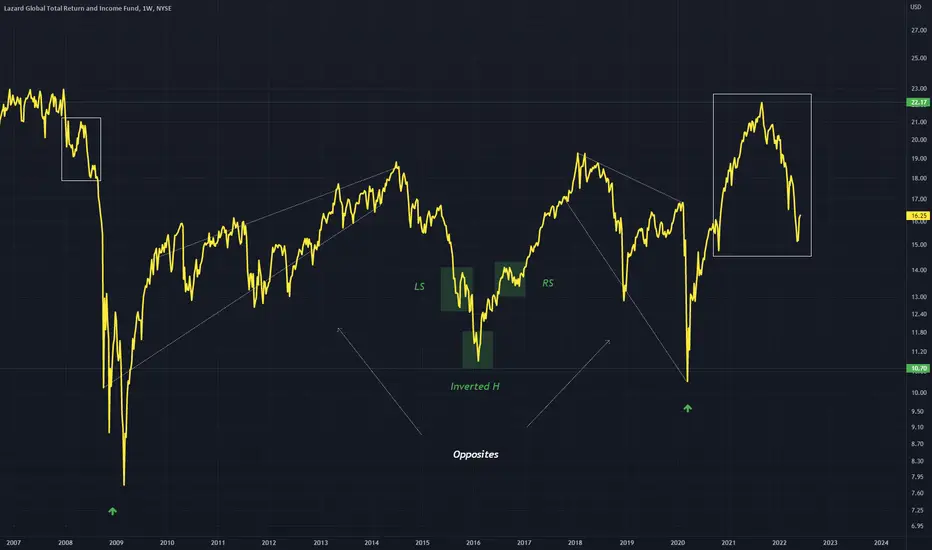
A chart for LGI, price is in a relatively tight range on this Weekly timeframe, it has repeated a chart pattern in an inverted fashion
White rectangle is where we are currently with price and should retest green as it did in the first situation inversely on the first white rectangle
Both are wedge patterns
White rectangle is where we are currently with price and should retest green as it did in the first situation inversely on the first white rectangle
Both are wedge patterns
Thông báo miễn trừ trách nhiệm
Thông tin và ấn phẩm không có nghĩa là và không cấu thành, tài chính, đầu tư, kinh doanh, hoặc các loại lời khuyên hoặc khuyến nghị khác được cung cấp hoặc xác nhận bởi TradingView. Đọc thêm trong Điều khoản sử dụng.
Thông báo miễn trừ trách nhiệm
Thông tin và ấn phẩm không có nghĩa là và không cấu thành, tài chính, đầu tư, kinh doanh, hoặc các loại lời khuyên hoặc khuyến nghị khác được cung cấp hoặc xác nhận bởi TradingView. Đọc thêm trong Điều khoản sử dụng.