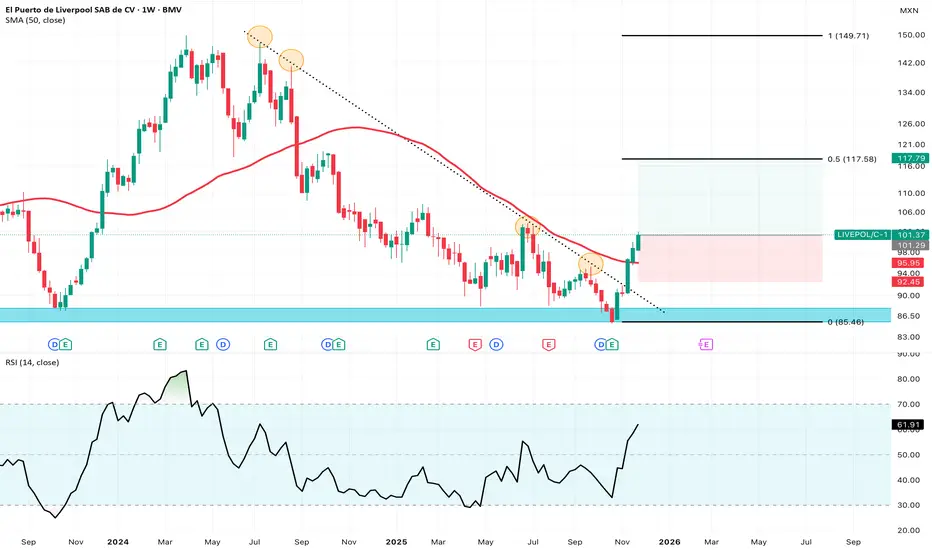
Stock price just broke a major downward trend line that has kept the price pressured since the last quarter of 2024. RSI breaching 50 after an aggressive bounce from the $85-$87 multi-year demand zone. The 50-week SMA, which was also surpassed, has recently been proved as an efficient trend indicator tool.
I’ve had a long position for some time now, so if I started a new one today, i would consider a 50% retracement from recent highs as a first price target, and a weekly close below the 50M SMA as a stop loss.
On the daily chart, the RSI is signaling extreme overbought conditions, so I wouldn’t be surprised if we saw some consolidation pattern form in the upcoming weeks.
I like this stock for the upcoming year.
Thông báo miễn trừ trách nhiệm
Thông tin và các ấn phẩm này không nhằm mục đích, và không cấu thành, lời khuyên hoặc khuyến nghị về tài chính, đầu tư, giao dịch hay các loại khác do TradingView cung cấp hoặc xác nhận. Đọc thêm tại Điều khoản Sử dụng.
Thông báo miễn trừ trách nhiệm
Thông tin và các ấn phẩm này không nhằm mục đích, và không cấu thành, lời khuyên hoặc khuyến nghị về tài chính, đầu tư, giao dịch hay các loại khác do TradingView cung cấp hoặc xác nhận. Đọc thêm tại Điều khoản Sử dụng.