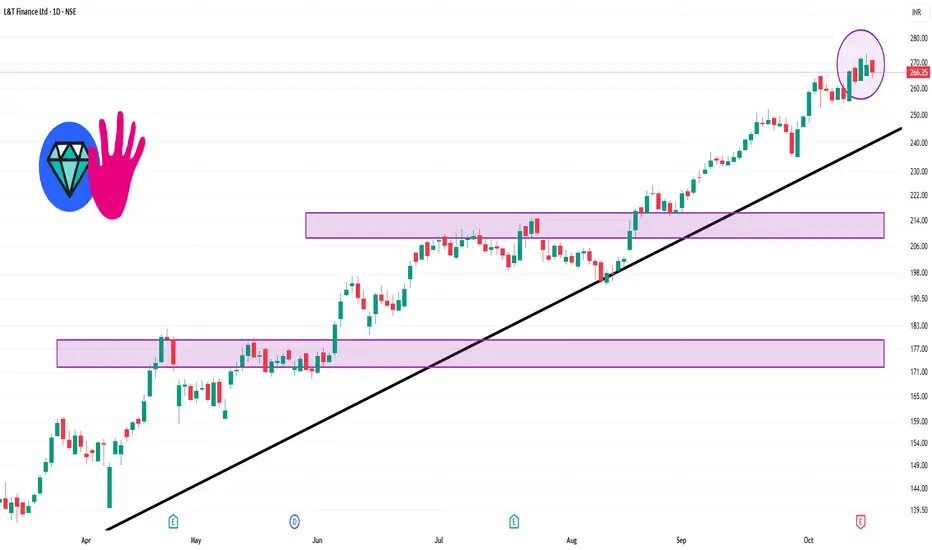
📊 Intraday Support and Resistance Levels
Immediate Support: ₹263.19
First Resistance: ₹270.14
Second Resistance: ₹274.02
Third Resistance: ₹277.09
These levels are derived from pivot point calculations and are commonly used by traders to identify potential entry and exit points.
📈 Technical Indicators
Relative Strength Index (RSI): 63.91, indicating that the stock is approaching overbought territory.
Money Flow Index (MFI): 78.20, suggesting strong buying interest.
MACD: The MACD line is at 9.28, with the signal line at 9.06, showing a bullish crossover.
Average True Range (ATR): ₹7.16, reflecting moderate volatility.
Average Directional Index (ADX): 38.39, indicating a strong trend.
Bài đăng liên quan
Thông báo miễn trừ trách nhiệm
Thông tin và các ấn phẩm này không nhằm mục đích, và không cấu thành, lời khuyên hoặc khuyến nghị về tài chính, đầu tư, giao dịch hay các loại khác do TradingView cung cấp hoặc xác nhận. Đọc thêm tại Điều khoản Sử dụng.
Bài đăng liên quan
Thông báo miễn trừ trách nhiệm
Thông tin và các ấn phẩm này không nhằm mục đích, và không cấu thành, lời khuyên hoặc khuyến nghị về tài chính, đầu tư, giao dịch hay các loại khác do TradingView cung cấp hoặc xác nhận. Đọc thêm tại Điều khoản Sử dụng.