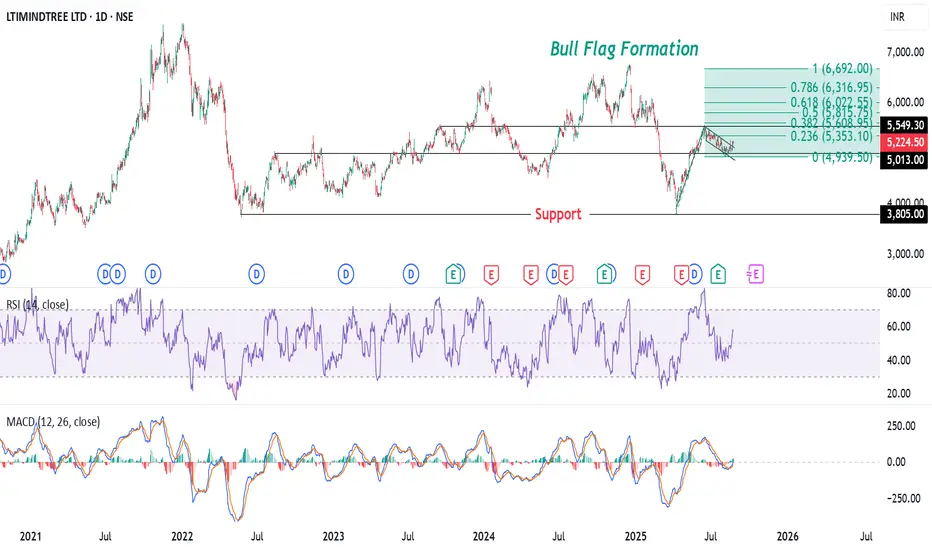
The chart of LTIMINDTREE LTD shows a Bull Flag formation, a bullish continuation pattern that typically appears after a strong upward move. The flagpole is represented by the sharp price rally, from 3,800, followed by a downward-sloping consolidation channel forming the flag.
This pattern suggests a potential breakout to the upside, supported by the Fibonacci extension levels projecting targets up to the .618 fib ext. level at ₹6,022. The RSI is near 56.89, indicating moderate strength, while the MACD shows a possible bullish crossover, further reinforcing the bullish outlook. The key support level is around ₹5,000, and a breakout above the flag could signal a resumption of the uptrend.
Disclaimer: The information provided in this analysis is for educational and informational purposes only and should not be considered as financial or investment advice.
Thông báo miễn trừ trách nhiệm
Thông tin và các ấn phẩm này không nhằm mục đích, và không cấu thành, lời khuyên hoặc khuyến nghị về tài chính, đầu tư, giao dịch hay các loại khác do TradingView cung cấp hoặc xác nhận. Đọc thêm tại Điều khoản Sử dụng.
Thông báo miễn trừ trách nhiệm
Thông tin và các ấn phẩm này không nhằm mục đích, và không cấu thành, lời khuyên hoặc khuyến nghị về tài chính, đầu tư, giao dịch hay các loại khác do TradingView cung cấp hoặc xác nhận. Đọc thêm tại Điều khoản Sử dụng.