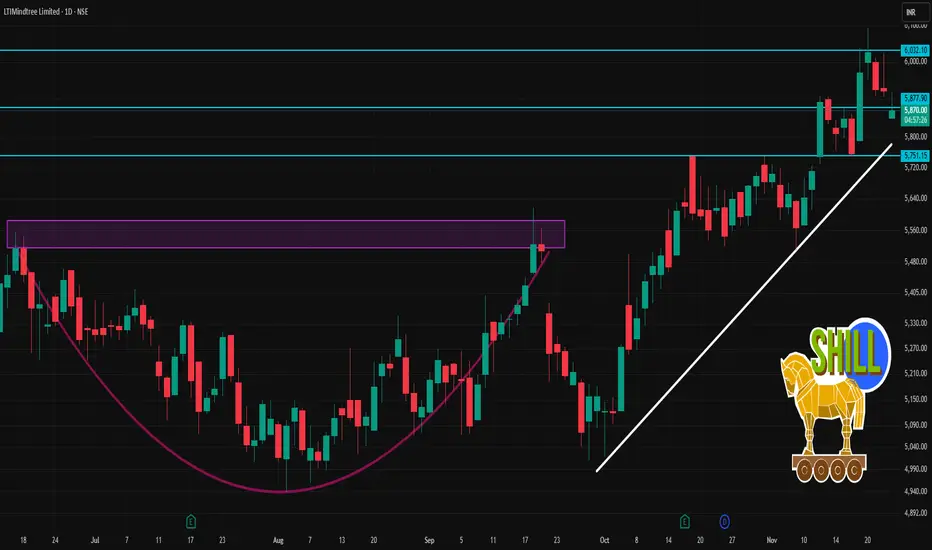
🧮 Key Data Snapshot
Previous close: ~ ₹ 5,922.
Today’s intraday low: ~ ₹ 5,850.
Today’s intraday high: ~ ₹ 5,918.
52-week range: Low ~ ₹ 3,802, High ~ ₹ 6,767.95.
📌 1-Day Technical Levels to Watch
Support levels:
~ ₹ 5,850 — today’s intraday low; if price dips below this it may signal intraday weakness.
~ ₹ 5,760-5,770 — a slightly lower zone (recent intraday “floor” area) that could act as secondary support.
If those break, next meaningful structural support might be closer to ~ ₹ 5,500-5,600 (though further away, so bigger risk).
Resistance levels:
~ ₹ 5,918-5,920 — today’s intraday high; a breakout above this could open upside for the day.
~ ₹ 6,000 — psychological and round number resistance; if momentum pushes, this is the next target.
Above that, near the 52-week high (~₹ 6,767) but that’s more medium-term than for intraday.
🎯 Intraday Trading Scenarios
Bullish intra-day trade: If price holds above ~₹ 5,850 and breaks above ~₹ 5,920 with volume, one could target ~₹ 6,000 or slightly above for the day, with a stop-loss below ~₹ 5,850 (or even ~₹ 5,770 depending on risk tolerance).
Bearish intra-day trade: If price fails to hold ~₹ 5,850, and breaks down with momentum, one could look at a short, targeting ~₹ 5,700 or ~₹ 5,600. Stop-loss would be above ~₹ 5,910 zone.
Range-bound play: If the price continues to oscillate between ~₹ 5,850 and ~₹ 5,920, one might play the range – buy near the lower bound, sell near the upper bound, but keep stops tight.
Bài đăng liên quan
Thông báo miễn trừ trách nhiệm
Thông tin và các ấn phẩm này không nhằm mục đích, và không cấu thành, lời khuyên hoặc khuyến nghị về tài chính, đầu tư, giao dịch hay các loại khác do TradingView cung cấp hoặc xác nhận. Đọc thêm tại Điều khoản Sử dụng.
Bài đăng liên quan
Thông báo miễn trừ trách nhiệm
Thông tin và các ấn phẩm này không nhằm mục đích, và không cấu thành, lời khuyên hoặc khuyến nghị về tài chính, đầu tư, giao dịch hay các loại khác do TradingView cung cấp hoặc xác nhận. Đọc thêm tại Điều khoản Sử dụng.