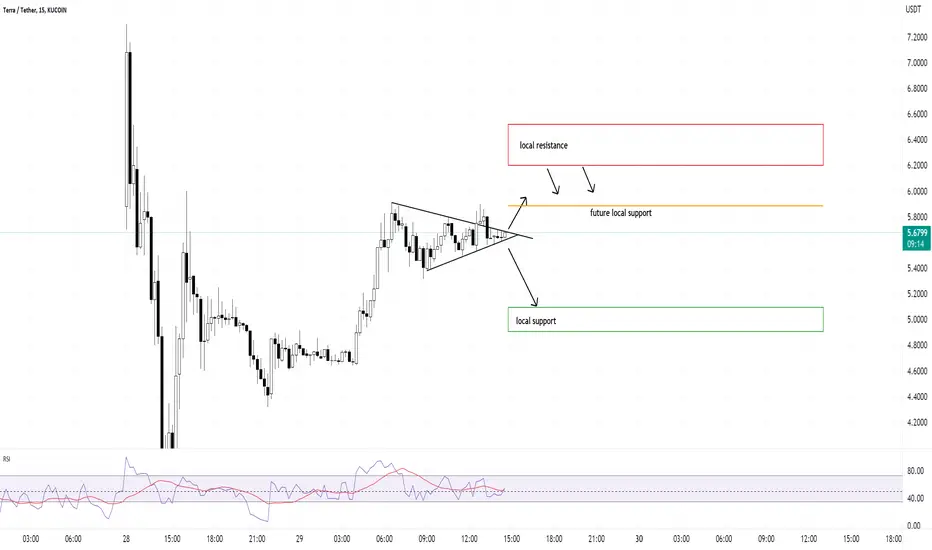
We are in a triangular formation which is neutral indicator. If the price had a bullish phase, there is a possibility of continuation. If the price rises, the highlighted resistance zone should be where most sell orders are sitting.
*** WARNING : Luna is extremely volatile at the moment, and yeah it might even go way past $6 up to $20, but the reverse is also possible.****
If it behaves well when the price starts going lower, then the local support zone is highlighted in green. There should be a big volume there, which should help price stabilize or get back up.
TLDR: Can go either way really fast
Ghi chú
resistance area hit! will post a new chartĐã hủy lệnh
Guys I don't know what happened, but the chart is broken on my screen, it won't load properly. So I am abandoning this postThông báo miễn trừ trách nhiệm
Thông tin và ấn phẩm không có nghĩa là và không cấu thành, tài chính, đầu tư, kinh doanh, hoặc các loại lời khuyên hoặc khuyến nghị khác được cung cấp hoặc xác nhận bởi TradingView. Đọc thêm trong Điều khoản sử dụng.
Thông báo miễn trừ trách nhiệm
Thông tin và ấn phẩm không có nghĩa là và không cấu thành, tài chính, đầu tư, kinh doanh, hoặc các loại lời khuyên hoặc khuyến nghị khác được cung cấp hoặc xác nhận bởi TradingView. Đọc thêm trong Điều khoản sử dụng.