On 8th September, M&M broke the previous day’s high and rallied nearly 4%. However, it soon entered a gradual downtrend on the hourly timeframe, holding the ₹3575 level (the high of 5th September, now acting as support).
After a day of consolidation, the stock broke below ₹3575 and closed beneath it. In the following session, it faced resistance at the same level but later broke above it again, suggesting a false breakout.
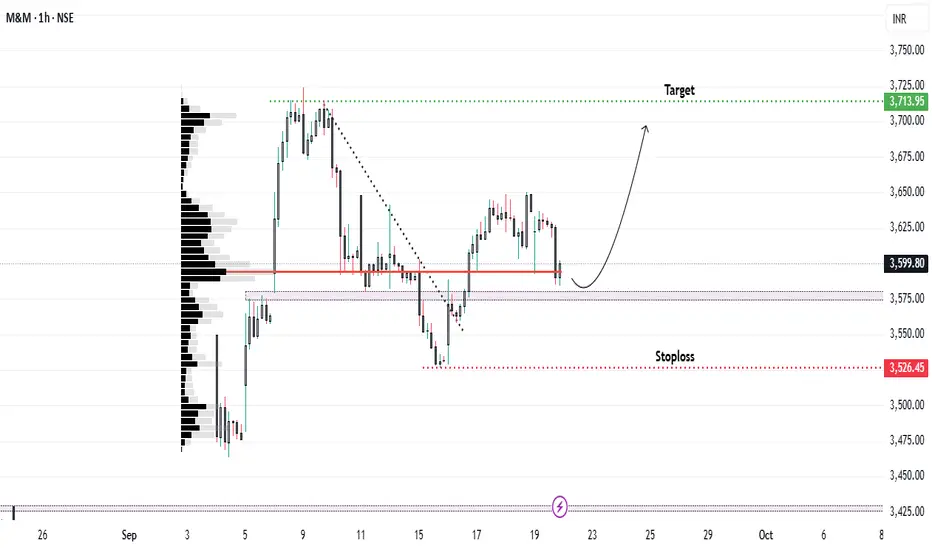
Currently, the stock is retesting this zone. The Volume Profile indicator shows a significant high-volume cluster around ₹3600, adding importance to this level.
📊 Trade Setup
* Entry: ₹3585
* Target: ₹3700 (recent swing high)
* Stoploss: ₹3526
⚠️ Note
Due to uncertainty around the US-India trade deal and developments in the auto sector, volatility may increase. Trade cautiously and manage risk effectively.
After a day of consolidation, the stock broke below ₹3575 and closed beneath it. In the following session, it faced resistance at the same level but later broke above it again, suggesting a false breakout.
Currently, the stock is retesting this zone. The Volume Profile indicator shows a significant high-volume cluster around ₹3600, adding importance to this level.
📊 Trade Setup
* Entry: ₹3585
* Target: ₹3700 (recent swing high)
* Stoploss: ₹3526
⚠️ Note
Due to uncertainty around the US-India trade deal and developments in the auto sector, volatility may increase. Trade cautiously and manage risk effectively.
Thông báo miễn trừ trách nhiệm
Thông tin và ấn phẩm không có nghĩa là và không cấu thành, tài chính, đầu tư, kinh doanh, hoặc các loại lời khuyên hoặc khuyến nghị khác được cung cấp hoặc xác nhận bởi TradingView. Đọc thêm trong Điều khoản sử dụng.
Thông báo miễn trừ trách nhiệm
Thông tin và ấn phẩm không có nghĩa là và không cấu thành, tài chính, đầu tư, kinh doanh, hoặc các loại lời khuyên hoặc khuyến nghị khác được cung cấp hoặc xác nhận bởi TradingView. Đọc thêm trong Điều khoản sử dụng.