💡 To see my confluences and/or linework: Step 1: Grab chart 📊, Step 2: Unhide Group 1 in object tree 🎯, Step 3: Hide and unhide specific confluences one by one ✨. Double-click the screen to reveal RSI, MFI, CVD, and OBV indicators alongside divergence markings! 📈
The Market Participant Battle:
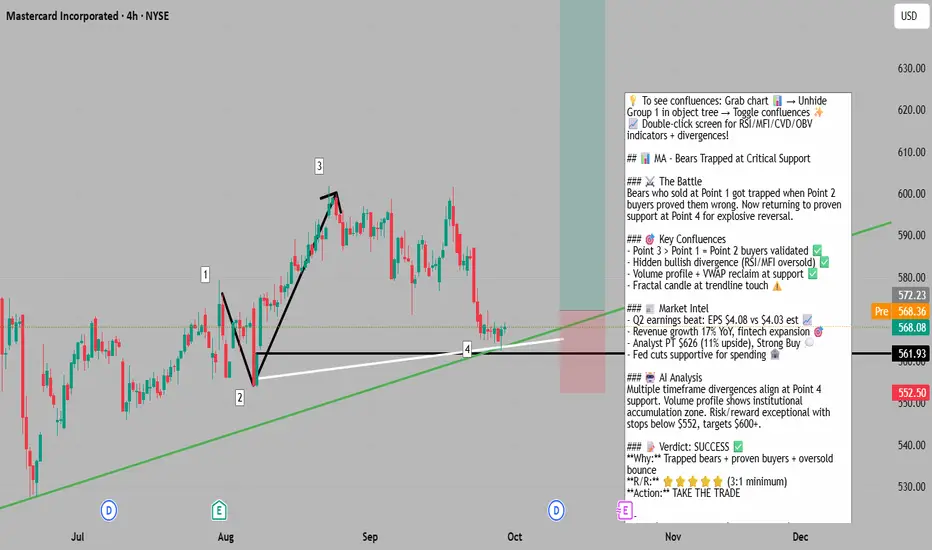
Bears trapped selling at critical support (Point 1) got proven wrong when bulls defended Point 2, confirming genuine buying strength. At Point 4, we're returning to these proven buyers who successfully defended the selloff attempt. Price is expected to spring higher as trapped bears cover and new buyers recognize the strength of this support zone.
Confluences:
Confluence 1: The Number Pattern (1→4 Price Action)
Point 3 closes above Point 1, marking Point 2 buyers as proven market participants who successfully disproved the bearish thesis from Point 1. At Point 4, we're returning to this proven set of buyers. The trendline lands exactly at Point 4, which happens to be a fractal candle with divergence on lower timeframes. This isn't just support - it's a confluence of multiple technical validations.
Confluence 2: Hidden Bullish Divergence Cluster
Between Points 2→4, price forms a higher low while RSI and MFI make lower lows, creating hidden bullish divergence. Both RSI and MFI are oversold at Point 4, adding strength to the reversal signal. CVD shows bullish divergence as well, and all divergences become layered with divergence appearing on the candle level - a powerful multi-timeframe confirmation.
Confluence 3: Volume Profile & VWAP Dynamics
Anchored volume profile from Point 0 shows price dipped under the developing POC, just now closing back above - a bullish reclaim. Volume profile on the 1→2 swing shows price reacting precisely to the value area low. VWAP at Point 1 shows price pulled under the 1st deviation heading toward the 2nd, but pulled back and closed above the 1st deviation, showing seller weakness and buyer strength emerging.
Web Research Findings:
- Technical Analysis: MA currently at $567-583 range with strong support at $534, RSI at 42-60 (neutral to slightly oversold), MACD showing buy signals
- Recent News/Earnings: Q2 2025 earnings beat expectations (EPS $4.08 vs $4.03 est), net revenue growth 16-17% YoY, strong fintech partnerships with 11 new startups
- Analyst Sentiment: Strong Buy consensus with 35 analysts, average PT $626 (11% upside), highest PT $690 from UBS
- Data Releases & Economic Calendar: Q3 earnings on Oct 23, 2025 expected EPS $4.31
- Interest Rate Impact: Fed cut rates to 4.00-4.25% in Sept, two more cuts expected in 2025 - positive for consumer spending and MA transaction volumes
Layman's Summary:
Mastercard is showing strong business growth with revenues up 17% and beating earnings expectations. The stock found support exactly where technical patterns suggested buyers would step in. With the Fed cutting rates (making it cheaper to borrow and spend), consumer transactions should increase. Wall Street analysts love the stock with an average target 11% higher. The company is expanding aggressively in fintech and emerging markets. In simple terms: The business is growing fast, the stock is at a good technical entry point, and the economic environment is becoming more favorable for payment companies.
Machine Derived Information:
- Image 1: Daily chart showing Points 1-4 pattern with clear support zone at $561-566 - Significance: Strong institutional buying zone confirmed - AGREES ✔
- Image 2: Zoomed view highlighting volume profile and VWAP interactions - Significance: Multiple technical validations at current levels - AGREES ✔
- Image 3: Full pattern view with all confluences visible - Significance: Comprehensive bullish setup with risk/reward clearly defined - AGREES ✔
Actionable Machine Summary:
All technical indicators align bullishly at Point 4. The fractal candle formation, combined with oversold conditions on oscillators, hidden bullish divergence across multiple indicators, and volume profile support creates an extremely high-probability reversal zone. The fact that multiple timeframes show the same bullish signals increases confidence. Entry at current levels ($566-569) with stops below Point 2 ($552) offers excellent risk/reward targeting the $600+ resistance zone.
Conclusion:
Trade Prediction: SUCCESS
Confidence: High
The confluence of trapped bears at proven support, multiple divergences, volume profile dynamics, strong fundamentals (17% revenue growth), and favorable analyst sentiment creates a compelling long setup. With Fed rate cuts supporting consumer spending and MA's aggressive fintech expansion, both technicals and fundamentals align for upside. Risk/reward strongly favors longs with clear stop below $552 and targets at $600-620 range.
The Market Participant Battle:
Bears trapped selling at critical support (Point 1) got proven wrong when bulls defended Point 2, confirming genuine buying strength. At Point 4, we're returning to these proven buyers who successfully defended the selloff attempt. Price is expected to spring higher as trapped bears cover and new buyers recognize the strength of this support zone.
Confluences:
Confluence 1: The Number Pattern (1→4 Price Action)
Point 3 closes above Point 1, marking Point 2 buyers as proven market participants who successfully disproved the bearish thesis from Point 1. At Point 4, we're returning to this proven set of buyers. The trendline lands exactly at Point 4, which happens to be a fractal candle with divergence on lower timeframes. This isn't just support - it's a confluence of multiple technical validations.
Confluence 2: Hidden Bullish Divergence Cluster
Between Points 2→4, price forms a higher low while RSI and MFI make lower lows, creating hidden bullish divergence. Both RSI and MFI are oversold at Point 4, adding strength to the reversal signal. CVD shows bullish divergence as well, and all divergences become layered with divergence appearing on the candle level - a powerful multi-timeframe confirmation.
Confluence 3: Volume Profile & VWAP Dynamics
Anchored volume profile from Point 0 shows price dipped under the developing POC, just now closing back above - a bullish reclaim. Volume profile on the 1→2 swing shows price reacting precisely to the value area low. VWAP at Point 1 shows price pulled under the 1st deviation heading toward the 2nd, but pulled back and closed above the 1st deviation, showing seller weakness and buyer strength emerging.
Web Research Findings:
- Technical Analysis: MA currently at $567-583 range with strong support at $534, RSI at 42-60 (neutral to slightly oversold), MACD showing buy signals
- Recent News/Earnings: Q2 2025 earnings beat expectations (EPS $4.08 vs $4.03 est), net revenue growth 16-17% YoY, strong fintech partnerships with 11 new startups
- Analyst Sentiment: Strong Buy consensus with 35 analysts, average PT $626 (11% upside), highest PT $690 from UBS
- Data Releases & Economic Calendar: Q3 earnings on Oct 23, 2025 expected EPS $4.31
- Interest Rate Impact: Fed cut rates to 4.00-4.25% in Sept, two more cuts expected in 2025 - positive for consumer spending and MA transaction volumes
Layman's Summary:
Mastercard is showing strong business growth with revenues up 17% and beating earnings expectations. The stock found support exactly where technical patterns suggested buyers would step in. With the Fed cutting rates (making it cheaper to borrow and spend), consumer transactions should increase. Wall Street analysts love the stock with an average target 11% higher. The company is expanding aggressively in fintech and emerging markets. In simple terms: The business is growing fast, the stock is at a good technical entry point, and the economic environment is becoming more favorable for payment companies.
Machine Derived Information:
- Image 1: Daily chart showing Points 1-4 pattern with clear support zone at $561-566 - Significance: Strong institutional buying zone confirmed - AGREES ✔
- Image 2: Zoomed view highlighting volume profile and VWAP interactions - Significance: Multiple technical validations at current levels - AGREES ✔
- Image 3: Full pattern view with all confluences visible - Significance: Comprehensive bullish setup with risk/reward clearly defined - AGREES ✔
Actionable Machine Summary:
All technical indicators align bullishly at Point 4. The fractal candle formation, combined with oversold conditions on oscillators, hidden bullish divergence across multiple indicators, and volume profile support creates an extremely high-probability reversal zone. The fact that multiple timeframes show the same bullish signals increases confidence. Entry at current levels ($566-569) with stops below Point 2 ($552) offers excellent risk/reward targeting the $600+ resistance zone.
Conclusion:
Trade Prediction: SUCCESS
Confidence: High
The confluence of trapped bears at proven support, multiple divergences, volume profile dynamics, strong fundamentals (17% revenue growth), and favorable analyst sentiment creates a compelling long setup. With Fed rate cuts supporting consumer spending and MA's aggressive fintech expansion, both technicals and fundamentals align for upside. Risk/reward strongly favors longs with clear stop below $552 and targets at $600-620 range.
Join free public community -> t.me/+ad-OZdmZq7M3MTg1
Thông báo miễn trừ trách nhiệm
Thông tin và ấn phẩm không có nghĩa là và không cấu thành, tài chính, đầu tư, kinh doanh, hoặc các loại lời khuyên hoặc khuyến nghị khác được cung cấp hoặc xác nhận bởi TradingView. Đọc thêm trong Điều khoản sử dụng.