📝 Description:
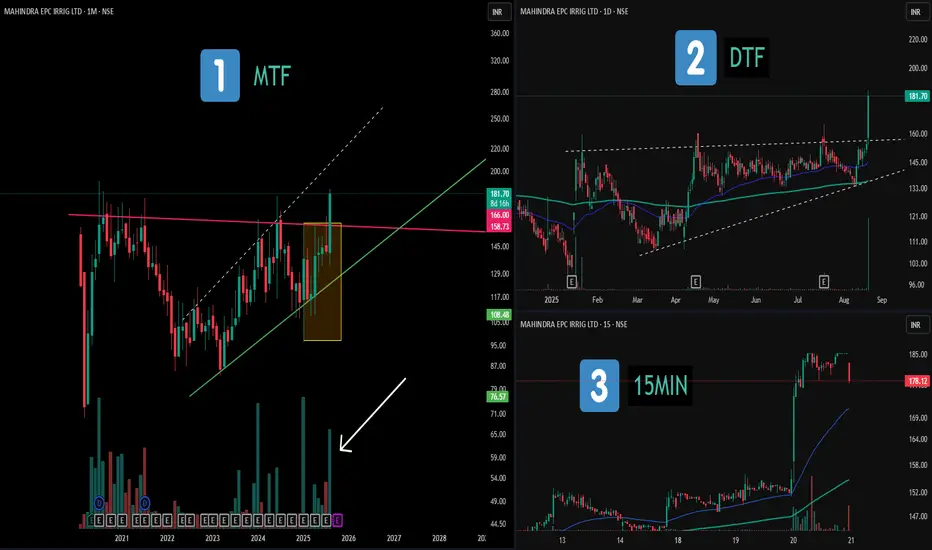
1️⃣ MTF (Monthly) – Displays a broad consolidation structure with a hidden broadening formation and notable volume clusters marked in recent candles.
2️⃣ DTF (Daily) – Highlights an ascending triangle structure, with clear range boundaries and price compression before expansion.
3️⃣ 15MIN (Intraday) – Shows that the maximum price movement and volume activity occurred on a single candle, illustrating how momentum often concentrates in short bursts.
This chart setup serves as an educational view across multiple timeframes, showing how higher- and lower-TF structures can align.
⚠️ Disclaimer:
This post is purely for educational and structural analysis purposes. Not financial advice.
🎯 Master My Self-Made Trading Strategy
📈 Telegram (Learn Today): t.me/hashtaghammer
✅ WhatsApp (Learn Today): wa.me/919455664601
📈 Telegram (Learn Today): t.me/hashtaghammer
✅ WhatsApp (Learn Today): wa.me/919455664601
Bài đăng liên quan
Thông báo miễn trừ trách nhiệm
The information and publications are not meant to be, and do not constitute, financial, investment, trading, or other types of advice or recommendations supplied or endorsed by TradingView. Read more in the Terms of Use.