Observing Key Structural Patterns in Manaksia Coated Metals
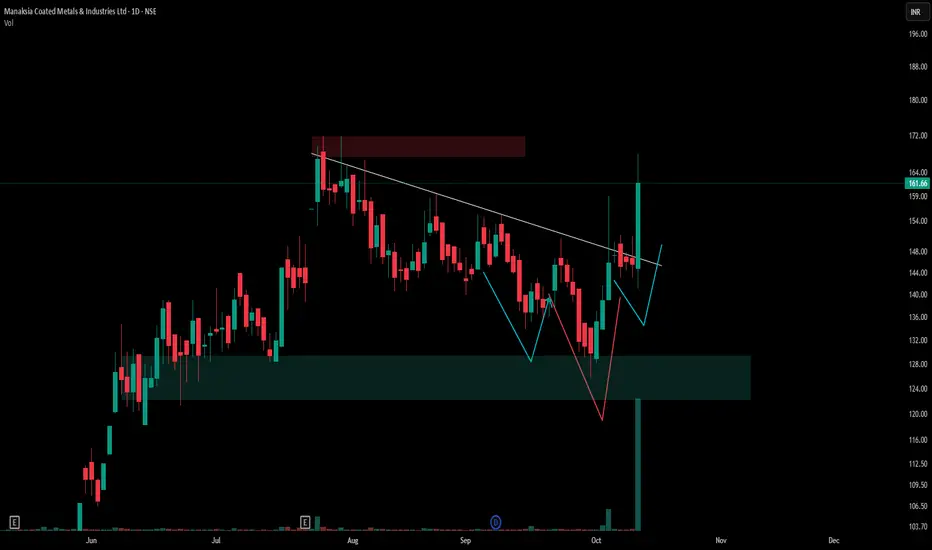
The daily chart of Manaksia Coated Metals & Industries Ltd (NSE) displays a confluence of notable technical formations. There is a clearly defined demand zone (highlighted in green) that has provided support for multiple sessions, as well as a supply area (marked at the upper region), signifying previous resistance.
A visually tight Volatility Contraction Pattern (VCP) is present, where price swings narrow progressively, indicating potential accumulation and increasing trader interest. The chart also reveals an inverted head and shoulders pattern, depicted using blue and red lines, which is often recognized as a classic reversal formation in technical analysis.
No attempt is made to forecast price movement; the Chart purely reflects observed market structure and patterns.
Disclaimer
This post is for educational and observational purposes only. It does not constitute financial advice or a trading recommendation. Always conduct your own research and consult a certified financial advisor before making investment decisions.
🎯 Master My Self-Made Trading Strategy
📈 Telegram (Learn Today): t.me/hashtaghammer
✅ WhatsApp (Learn Today): wa.me/919455664601
📈 Telegram (Learn Today): t.me/hashtaghammer
✅ WhatsApp (Learn Today): wa.me/919455664601
Bài đăng liên quan
Thông báo miễn trừ trách nhiệm
Thông tin và các ấn phẩm này không nhằm mục đích, và không cấu thành, lời khuyên hoặc khuyến nghị về tài chính, đầu tư, giao dịch hay các loại khác do TradingView cung cấp hoặc xác nhận. Đọc thêm tại Điều khoản Sử dụng.