Fibonacci is one of the important tool to predict and understand the retracement of the stock.
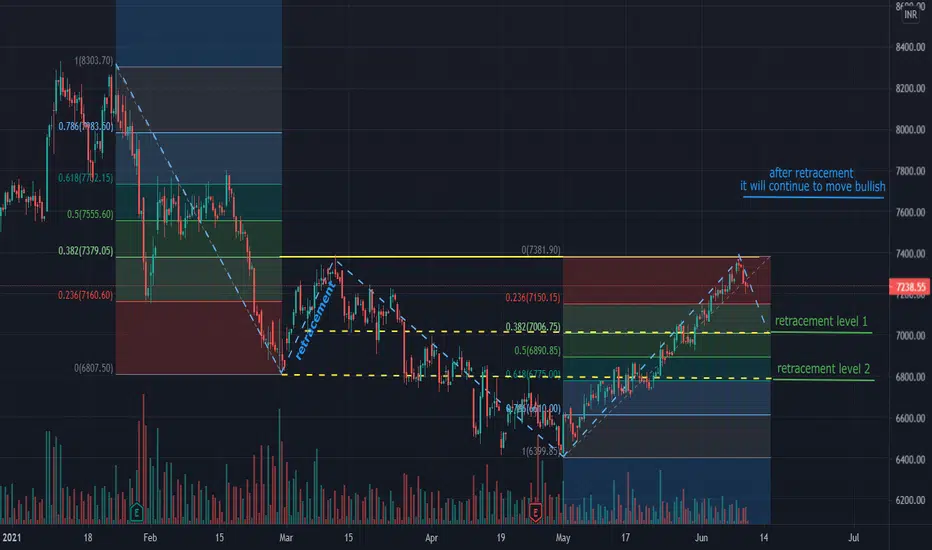
MARUTI SUZUKI was in down trend since mid of Feb started retracement on 26th of Feb around 8610 and retraced by 38.2% till 7372, which is also a price at the current date. after this retracement it continued the down trend.
A trend reversal is observed on 30th of April and stock moved bullish since then. Now, it has reached to the high of the symmetric level from past retracement (7372). It expected to retrace atleast by 38.2% or to max to the level of 61.8%.
pls keep an eye on it and pls comment your observations too.
Giao dịch đang hoạt động
approaching towards first retracement levelGiao dịch đang hoạt động
it took the retracement from level 2Đóng lệnh: đạt mục tiêu
target reached. Power of FibonacciThông báo miễn trừ trách nhiệm
Thông tin và các ấn phẩm này không nhằm mục đích, và không cấu thành, lời khuyên hoặc khuyến nghị về tài chính, đầu tư, giao dịch hay các loại khác do TradingView cung cấp hoặc xác nhận. Đọc thêm tại Điều khoản Sử dụng.
Thông báo miễn trừ trách nhiệm
Thông tin và các ấn phẩm này không nhằm mục đích, và không cấu thành, lời khuyên hoặc khuyến nghị về tài chính, đầu tư, giao dịch hay các loại khác do TradingView cung cấp hoặc xác nhận. Đọc thêm tại Điều khoản Sử dụng.