The Good
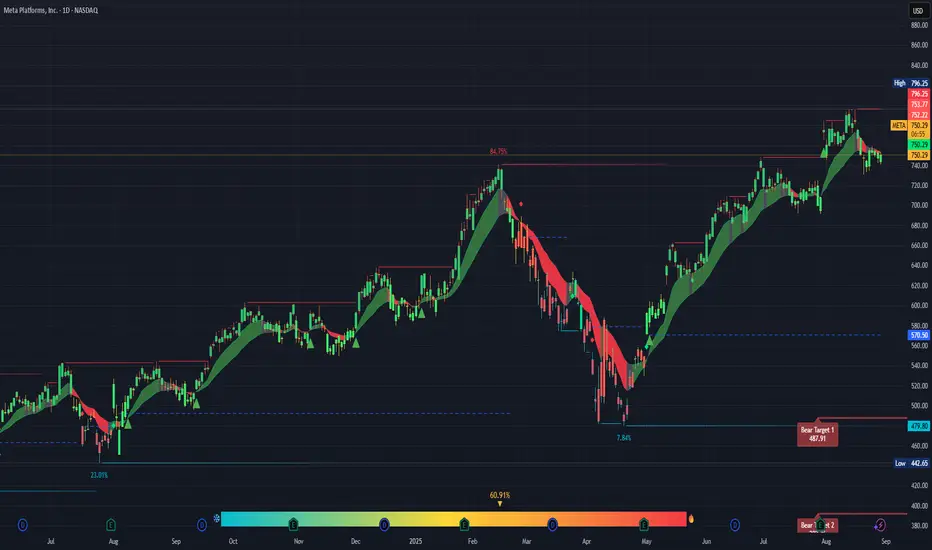
Trend: The longer-term trend is still up. You’ve had a strong run from the April low around ~$570 to the July high near ~$796. That’s nearly a 40% move.
Support Zone: The $740–$750 range looks like near-term support. Today’s close at $750.30 is sitting right on it. If this level holds, it’s constructive.
Momentum: Even with the recent pullback, the green trend ribbon shows the stock has mostly stayed in bullish structure since May.
The Risks
Resistance overhead: META hit a wall at $796.25 (previous high) and pulled back sharply. Until price reclaims that area, it’s a ceiling.
Distribution signs: The topping candles in July–August show selling pressure near the highs. If $740 fails, the next support is closer to $700–$710.
Bearish targets: Your chart shows a “Bear Target 1” at $487.91. That’s extreme, but it signals risk if the broader market turns.
Cost vs. Benefit
Upside: If $750 holds, META could retest $780–$796 (a potential ~6% upside).
Downside: If $740 breaks, META could revisit $700 (a ~7% downside), and if sentiment really cracks, $570 isn’t out of the question.
Brutally Honest Take
Right now META looks neutral to cautiously bullish—the longer trend is intact, but short-term momentum is shaky. This isn’t a “high-probability breakout” spot; it’s a wait-for-confirmation level. If you’re trading, the risk/reward is about even here.
Thông báo miễn trừ trách nhiệm
Thông tin và ấn phẩm không có nghĩa là và không cấu thành, tài chính, đầu tư, kinh doanh, hoặc các loại lời khuyên hoặc khuyến nghị khác được cung cấp hoặc xác nhận bởi TradingView. Đọc thêm trong Điều khoản sử dụng.
Thông báo miễn trừ trách nhiệm
Thông tin và ấn phẩm không có nghĩa là và không cấu thành, tài chính, đầu tư, kinh doanh, hoặc các loại lời khuyên hoặc khuyến nghị khác được cung cấp hoặc xác nhận bởi TradingView. Đọc thêm trong Điều khoản sử dụng.