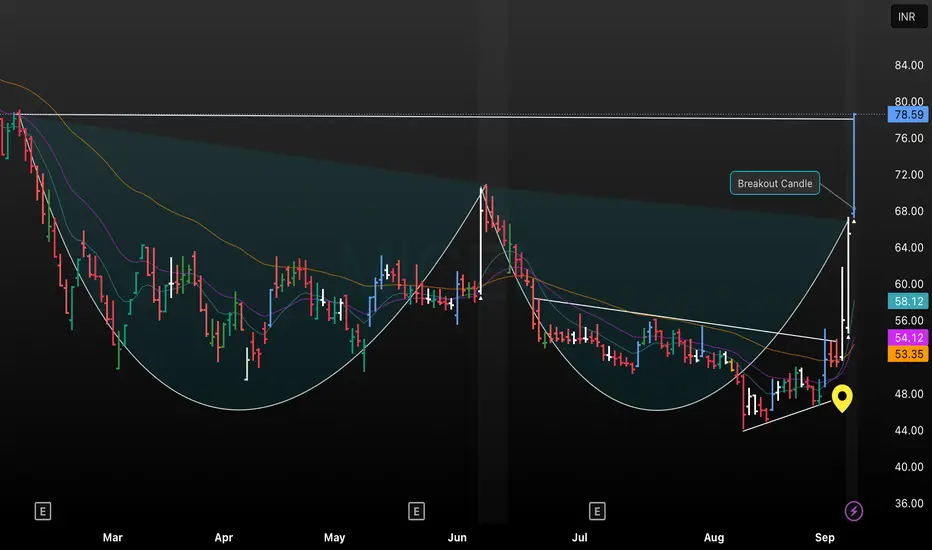
This chart shows the daily price action of MICEL, highlighting a classic cup and handle formation that developed over several months. The highlighted candle marks a strong breakout above the horizontal resistance near ₹78.59, confirming the pattern and signaling bullish momentum. Multiple moving averages are included for added trend analysis; the breakout volume and rapid price move suggest potential for further upside, making this setup significant for momentum traders.
Thông báo miễn trừ trách nhiệm
Thông tin và ấn phẩm không có nghĩa là và không cấu thành, tài chính, đầu tư, kinh doanh, hoặc các loại lời khuyên hoặc khuyến nghị khác được cung cấp hoặc xác nhận bởi TradingView. Đọc thêm trong Điều khoản sử dụng.
Thông báo miễn trừ trách nhiệm
Thông tin và ấn phẩm không có nghĩa là và không cấu thành, tài chính, đầu tư, kinh doanh, hoặc các loại lời khuyên hoặc khuyến nghị khác được cung cấp hoặc xác nhận bởi TradingView. Đọc thêm trong Điều khoản sử dụng.