Here’s a technical analysis of the MOSCHIP TECHNOLOGIES LTD (NSE: MOSCHIP) daily chart using the visible price action, Fibonacci retracement levels, RSI, MACD, and volume:
⸻
🔍 Price Action & Fibonacci Levels
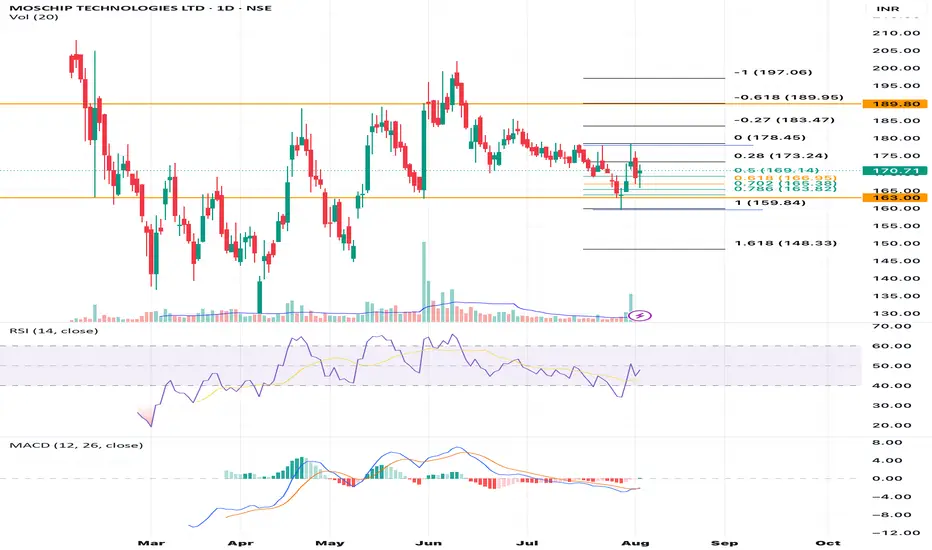
• Current Price: ₹170.71 (+1.22%)
• Price is at/near the 0.618 Fibonacci retracement level (~₹170.14), which often acts as a strong support/resistance.
• The price recently bounced off the ₹163.00 support zone (1.0 Fib), showing buying interest.
• Resistance levels ahead:
• ₹173.24 (0.28 Fib)
• ₹178.45 (0.0 Fib)
• ₹183.47 (-0.27 Fib)
• ₹189.80 (-0.618 Fib) — a major resistance zone.
⸻
📊 Volume Analysis
• A noticeable volume spike on the latest candle suggests strong participation (possibly institutional), indicating a potential short-term trend reversal or breakout.
⸻
💹 RSI (Relative Strength Index)
• RSI is around 50, indicating neutral momentum.
• It has bounced from below 40 recently, suggesting emerging bullish momentum.
• Not yet overbought — room for further upside if momentum continues.
⸻
📉 MACD (Moving Average Convergence Divergence)
• MACD and Signal Line are still below the zero line, indicating the overall trend is still bearish.
• However, the histogram is showing reducing bearish momentum (bars are getting shorter).
• A bullish crossover may be forming soon, which would support a further upward move.
⸻
📈 Summary & Outlook
Bullish Signs:
• Price rebounded from strong support at ₹163.
• Volume spike on up day — signs of accumulation.
• RSI is recovering.
• Possible bullish MACD crossover coming.
Bearish/Risk Factors:
• Price still under key resistance levels (₹173.24 & ₹178.45).
• MACD is still in bearish territory.
• Market may retest support if it fails to break ₹173-175 decisively.
⸻
🔔 Key Levels to Watch:
• Support: ₹163.00 / ₹160.14
• Resistance: ₹173.24 → ₹178.45 → ₹183.47 → ₹189.80
⸻
📝 Strategy Suggestion (Not Financial Advice):
• Bullish Bias above ₹170 with target at ₹173.24 → ₹178.45.
• Watch for breakout above ₹178.45 with strong volume for momentum trade.
• Stop-loss below ₹163 for swing trades.
⸻
🔍 Price Action & Fibonacci Levels
• Current Price: ₹170.71 (+1.22%)
• Price is at/near the 0.618 Fibonacci retracement level (~₹170.14), which often acts as a strong support/resistance.
• The price recently bounced off the ₹163.00 support zone (1.0 Fib), showing buying interest.
• Resistance levels ahead:
• ₹173.24 (0.28 Fib)
• ₹178.45 (0.0 Fib)
• ₹183.47 (-0.27 Fib)
• ₹189.80 (-0.618 Fib) — a major resistance zone.
⸻
📊 Volume Analysis
• A noticeable volume spike on the latest candle suggests strong participation (possibly institutional), indicating a potential short-term trend reversal or breakout.
⸻
💹 RSI (Relative Strength Index)
• RSI is around 50, indicating neutral momentum.
• It has bounced from below 40 recently, suggesting emerging bullish momentum.
• Not yet overbought — room for further upside if momentum continues.
⸻
📉 MACD (Moving Average Convergence Divergence)
• MACD and Signal Line are still below the zero line, indicating the overall trend is still bearish.
• However, the histogram is showing reducing bearish momentum (bars are getting shorter).
• A bullish crossover may be forming soon, which would support a further upward move.
⸻
📈 Summary & Outlook
Bullish Signs:
• Price rebounded from strong support at ₹163.
• Volume spike on up day — signs of accumulation.
• RSI is recovering.
• Possible bullish MACD crossover coming.
Bearish/Risk Factors:
• Price still under key resistance levels (₹173.24 & ₹178.45).
• MACD is still in bearish territory.
• Market may retest support if it fails to break ₹173-175 decisively.
⸻
🔔 Key Levels to Watch:
• Support: ₹163.00 / ₹160.14
• Resistance: ₹173.24 → ₹178.45 → ₹183.47 → ₹189.80
⸻
📝 Strategy Suggestion (Not Financial Advice):
• Bullish Bias above ₹170 with target at ₹173.24 → ₹178.45.
• Watch for breakout above ₹178.45 with strong volume for momentum trade.
• Stop-loss below ₹163 for swing trades.
Thông báo miễn trừ trách nhiệm
Thông tin và các ấn phẩm này không nhằm mục đích, và không cấu thành, lời khuyên hoặc khuyến nghị về tài chính, đầu tư, giao dịch hay các loại khác do TradingView cung cấp hoặc xác nhận. Đọc thêm tại Điều khoản Sử dụng.
Thông báo miễn trừ trách nhiệm
Thông tin và các ấn phẩm này không nhằm mục đích, và không cấu thành, lời khuyên hoặc khuyến nghị về tài chính, đầu tư, giao dịch hay các loại khác do TradingView cung cấp hoặc xác nhận. Đọc thêm tại Điều khoản Sử dụng.