Disclaimer: This is my personal analysis for educational purposes only. I am not SEBI-registered. Please consult your financial advisor before making any trading decisions.
🔎 Weekly Chart Setup
On the weekly timeframe, when plotting Fibonacci from the bottom (below 200 EMA) to the top (above 200 EMA):
Price retraced to the 0.5 level.
After holding this zone, it is again moving towards the highs.
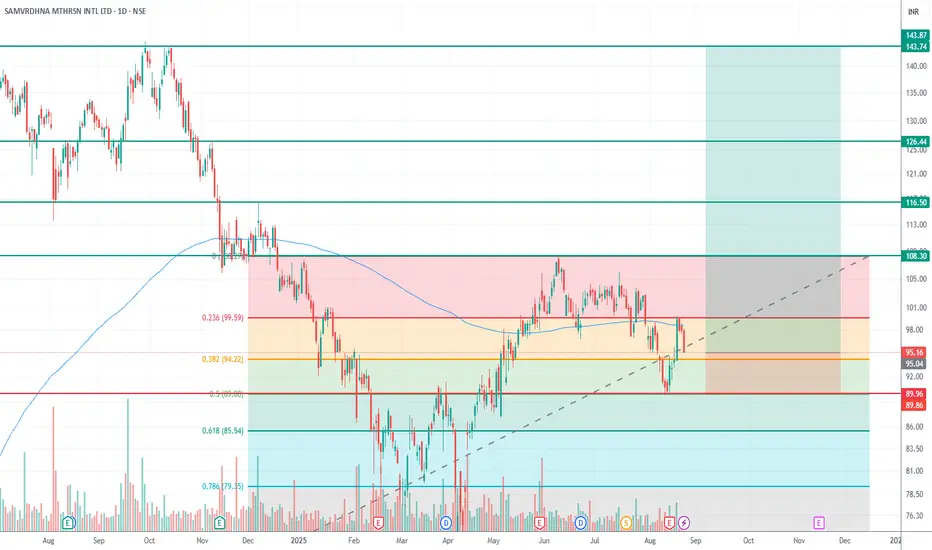
📈 Daily Chart Confirmation
Entry near CMP ~95.16.
Stop Loss: below 0.618 Fibonacci retracement → around 85 (safer SL).
Once the price crosses the first target, SL can be revised upward to the 0.5 level (~89–90).
🎯 Targets
First Target: Weekly high → 103–108
Second Target: 116
Third Target: 126
Final Target: 143
⚖️ Risk-Reward
Initial SL: 85
Entry: 95.16
Multiple profit targets with an approximate R:R > 1:5.
📌 Summary:
Weekly chart supports a bullish continuation after holding the 0.5 retracement.
The daily chart provides a clear risk-defined setup with a stop below 0.618.
Scaling out at targets and trailing SL increases the probability of locking profits.
🔎 Weekly Chart Setup
On the weekly timeframe, when plotting Fibonacci from the bottom (below 200 EMA) to the top (above 200 EMA):
Price retraced to the 0.5 level.
After holding this zone, it is again moving towards the highs.
📈 Daily Chart Confirmation
Entry near CMP ~95.16.
Stop Loss: below 0.618 Fibonacci retracement → around 85 (safer SL).
Once the price crosses the first target, SL can be revised upward to the 0.5 level (~89–90).
🎯 Targets
First Target: Weekly high → 103–108
Second Target: 116
Third Target: 126
Final Target: 143
⚖️ Risk-Reward
Initial SL: 85
Entry: 95.16
Multiple profit targets with an approximate R:R > 1:5.
📌 Summary:
Weekly chart supports a bullish continuation after holding the 0.5 retracement.
The daily chart provides a clear risk-defined setup with a stop below 0.618.
Scaling out at targets and trailing SL increases the probability of locking profits.
Giao dịch đang hoạt động
First Target of 109 AchievedThông báo miễn trừ trách nhiệm
Thông tin và ấn phẩm không có nghĩa là và không cấu thành, tài chính, đầu tư, kinh doanh, hoặc các loại lời khuyên hoặc khuyến nghị khác được cung cấp hoặc xác nhận bởi TradingView. Đọc thêm trong Điều khoản sử dụng.
Thông báo miễn trừ trách nhiệm
Thông tin và ấn phẩm không có nghĩa là và không cấu thành, tài chính, đầu tư, kinh doanh, hoặc các loại lời khuyên hoặc khuyến nghị khác được cung cấp hoặc xác nhận bởi TradingView. Đọc thêm trong Điều khoản sử dụng.