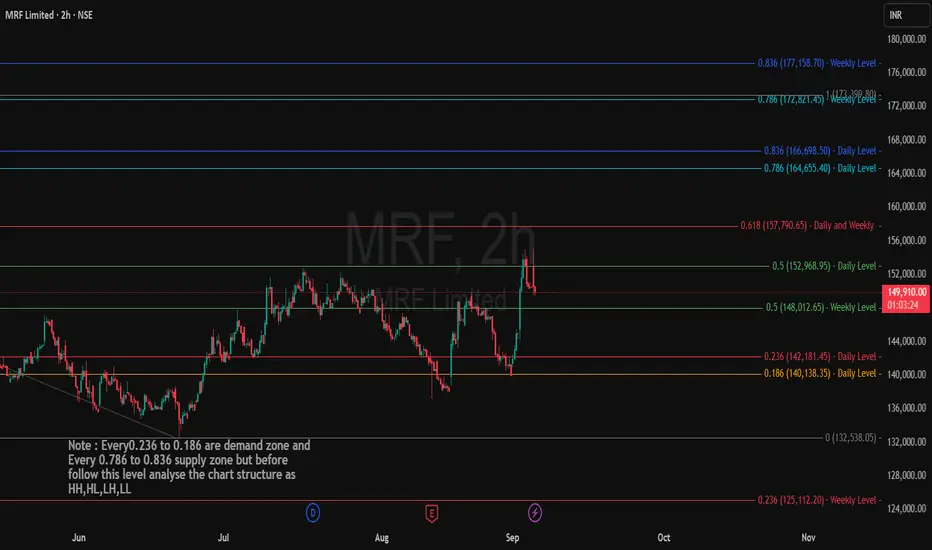
Step-by-Step Approach
1. Analyze Structure First
1. Analyze Structure First
- Check for market structure: Higher Highs (HH), Higher Lows (HL), Lower Highs (LH), and Lower Lows (LL).
- Only proceed if price action aligns with your desired trade direction.
2. Use Demand Zone for Buys - Watch for entries near 142,181.45 and 140,138.35 (Fibonacci 0.236–0.186, Daily Support).
- Enter long only if price structure shows reversal signs or supports form near these zones.
3. Use Supply Zone for Sells/Profit Booking - Look for exits or short setups around 164,655.40–166,698.50 (daily supply) or 172,821.45–177,158.70 (weekly supply).
- If in a long, consider booking profits as price approaches these resistance/supply levels
4. Confirm with Structure - Never trade just based on level; confirm with HH/HL (trend up, buy support) or LH/LL (trend down, sell resistance).
- Wait for bullish patterns at demand or bearish patterns at supply for confirmation.
5. Monitor Key Mid-Levels
Watch 148,012.65 (weekly mid) and 152,968.95 (daily mid) for interim reactions during moves (Which makes the sense of discount and Premium Zone)
6. Manage Risk - Set stop-loss just beyond demand/supply zones.
- Adjust position size to volatility and risk/reward.
7. Review Regularly - Reassess price action after each key level interaction.
- Modify bias if structure shifts (from uptrend to downtrend or vice versa).
- Following these rules keeps trading logic clear and helps avoid impulsive entries or exits.
Disclaimer:lnkd.in/gJJDnvn2
Thông báo miễn trừ trách nhiệm
Thông tin và ấn phẩm không có nghĩa là và không cấu thành, tài chính, đầu tư, kinh doanh, hoặc các loại lời khuyên hoặc khuyến nghị khác được cung cấp hoặc xác nhận bởi TradingView. Đọc thêm trong Điều khoản sử dụng.
Thông báo miễn trừ trách nhiệm
Thông tin và ấn phẩm không có nghĩa là và không cấu thành, tài chính, đầu tư, kinh doanh, hoặc các loại lời khuyên hoặc khuyến nghị khác được cung cấp hoặc xác nhận bởi TradingView. Đọc thêm trong Điều khoản sử dụng.