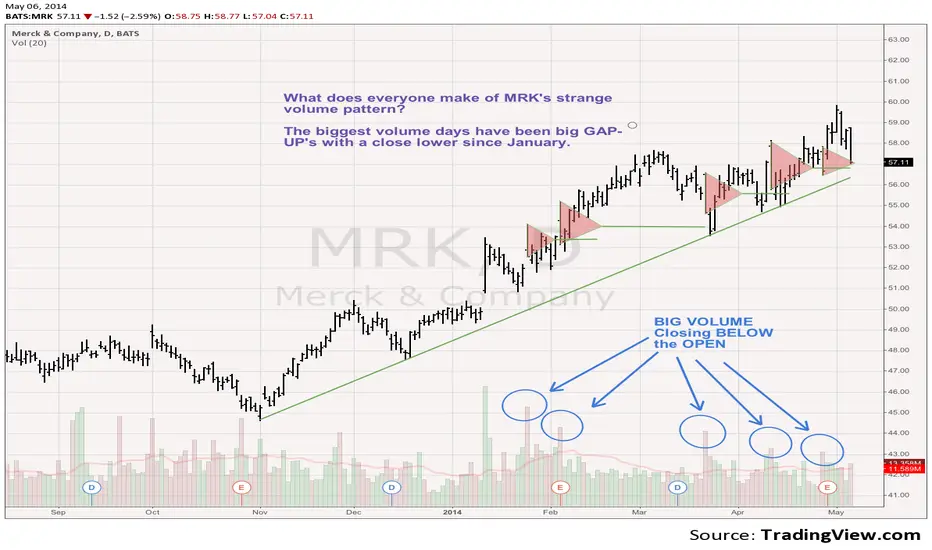
What do you make of this pattern of volume in Merck MRK here on the daily chart?
Each time this has happened since January it has moved higher, but I think it is distribution by a massive seller, akin to the days of Jesse Livermore. It is so unusual that I'd have to say in my nearly 30 years of watching charts that I haven't seen a chart look like this before. If MRK can break under one of these support lines, then it could mark the end of this uptrend. Granted I don't see tremendous downside risk, perhaps 10% or so.
Strategy: Sell short going under 57 with a 59 stop. Target initially 54-53.
Tim 4:16PM EST, May 6, 2014 57.11 last -1.52
Subscribe to my indicator package KEY HIDDEN LEVELS $10/mo or $100/year and join me in the trading room KEY HIDDEN LEVELS here at TradingView.com
Thông báo miễn trừ trách nhiệm
Thông tin và ấn phẩm không có nghĩa là và không cấu thành, tài chính, đầu tư, kinh doanh, hoặc các loại lời khuyên hoặc khuyến nghị khác được cung cấp hoặc xác nhận bởi TradingView. Đọc thêm trong Điều khoản sử dụng.
Thông báo miễn trừ trách nhiệm
Thông tin và ấn phẩm không có nghĩa là và không cấu thành, tài chính, đầu tư, kinh doanh, hoặc các loại lời khuyên hoặc khuyến nghị khác được cung cấp hoặc xác nhận bởi TradingView. Đọc thêm trong Điều khoản sử dụng.