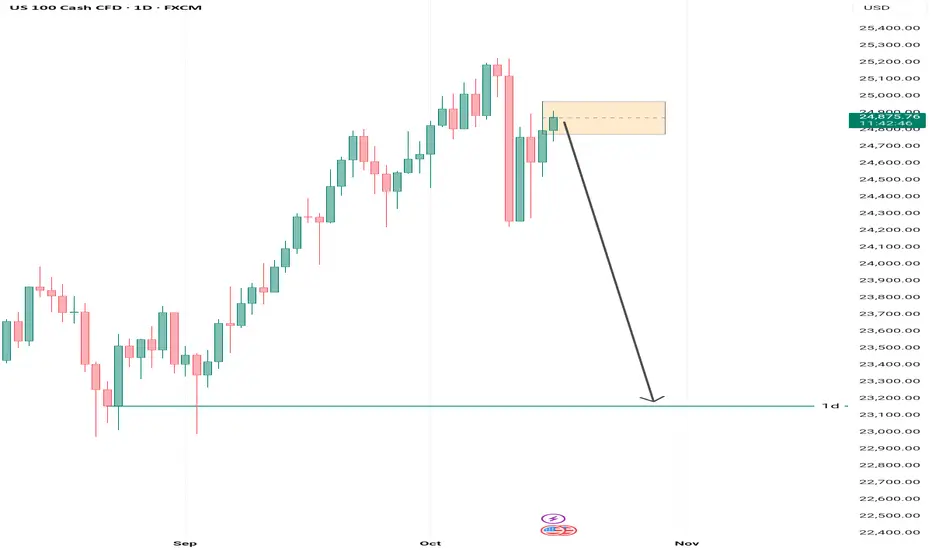
Based on the breakout observed on the 4-hour timeframe and its confirmation on the 30-minute chart — which itself was validated by the M5 structure break within the highlighted golden zone — we expect the price to continue its decline toward the first daily support level.
This setup provides a strong risk-to-reward ratio, as illustrated on the chart.
As always — stay patient, follow your plan, and trust your analysis.
Thông báo miễn trừ trách nhiệm
Thông tin và các ấn phẩm này không nhằm mục đích, và không cấu thành, lời khuyên hoặc khuyến nghị về tài chính, đầu tư, giao dịch hay các loại khác do TradingView cung cấp hoặc xác nhận. Đọc thêm tại Điều khoản Sử dụng.
Thông báo miễn trừ trách nhiệm
Thông tin và các ấn phẩm này không nhằm mục đích, và không cấu thành, lời khuyên hoặc khuyến nghị về tài chính, đầu tư, giao dịch hay các loại khác do TradingView cung cấp hoặc xác nhận. Đọc thêm tại Điều khoản Sử dụng.