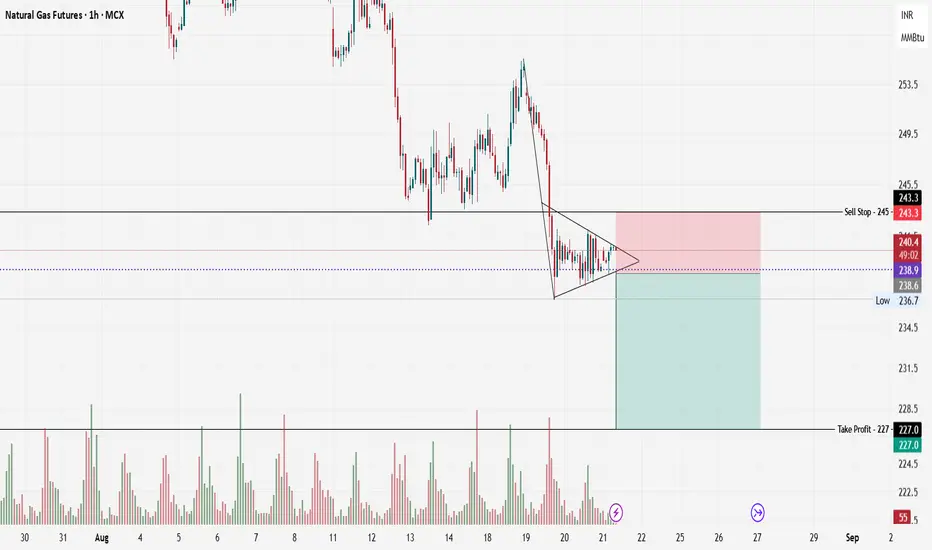
Here is my Natural Gas Futures (MCX, 1H) chart classic—candlesticks analysis.
Pattern Identification: The Bearish Pennant
I’ve spotted a textbook bearish pennant. Here’s how it forms and functions:
The pattern starts with a pronounced downward thrust (the flagpole), reflecting strong selling momentum.
Price action then contracts into a symmetrical triangle, as shown by the converging trend lines.
This pennant shape is a market’s “pause”: sellers digest gains, buyers offer token support, but neither side has control—for now.
The expectation “by the book” is that this pattern serves as a continuation formation, where a breakout (typically downward, in line with the preceding move) resumes the established trend.
Pattern Validation & Invalidation
Validation Criteria
Clear Downtrend: The initial flagpole is rapid and steep, matching textbook requirements.
Symmetrical Contraction: Multiple touches on both trendlines without breaking out show healthy consolidation.
Volume Confirmation: Notice how volume spikes before the consolidation, then diminishes as the pennant forms—a classic and critical signal. Lower volume during consolidation signifies indecision; a surge in volume on breakout validates the move.
Defined Risk/Reward: Levels for stop loss and target are clear and logical, anchored to visible support/resistance.
Invalidation Criteria
False Breakouts: If price breaks above the pennant’s upper boundary and sustains, the pattern is invalid.
Volume Anomaly: A breakout without accompanying volume suggests the move may not be trustworthy.
Failure to Breakout: Prolonged sideways action beyond the pennant’s apex reduces the pattern’s predictive value.
Capitalizing on the Analysis
If I want to turn this analytical insight into a trading opportunity, I’ll approach it methodically:
Wait for Confirmation: Act on the trade only when price closes below the lower trendline, and I’d like to see a volume spike to validate the breakout.
Set Entry and Risk: I position an entry order (sell stop) just below the pattern, around ₹238.6–₹240.
Define Stop Loss: I place my stop loss slightly above the upper pennant boundary—just above ₹243.3—to safeguard against failed breakdowns.
Calculate Target: My target is derived from the measured move principle—project the flagpole’s length from the breakout point, which centres the take profit around ₹227.
Size the Trade: I ensure my trade size aligns with my risk tolerance, strictly following capital management principles.
By systematically applying these rules, I aim to capitalize on the high-probability move that often follows a valid bearish pennant pattern.
Technical Chart Analyst
Track: Indian & US Markets
Indices | Commodities | Crypto
Telegram: @ChartPathik for NSE & MCX
& @ChartPathik_Global for US Ins. & Crypto
WhatsApp: +91-99293-91467 for updates.
Track: Indian & US Markets
Indices | Commodities | Crypto
Telegram: @ChartPathik for NSE & MCX
& @ChartPathik_Global for US Ins. & Crypto
WhatsApp: +91-99293-91467 for updates.
Thông báo miễn trừ trách nhiệm
Thông tin và ấn phẩm không có nghĩa là và không cấu thành, tài chính, đầu tư, kinh doanh, hoặc các loại lời khuyên hoặc khuyến nghị khác được cung cấp hoặc xác nhận bởi TradingView. Đọc thêm trong Điều khoản sử dụng.