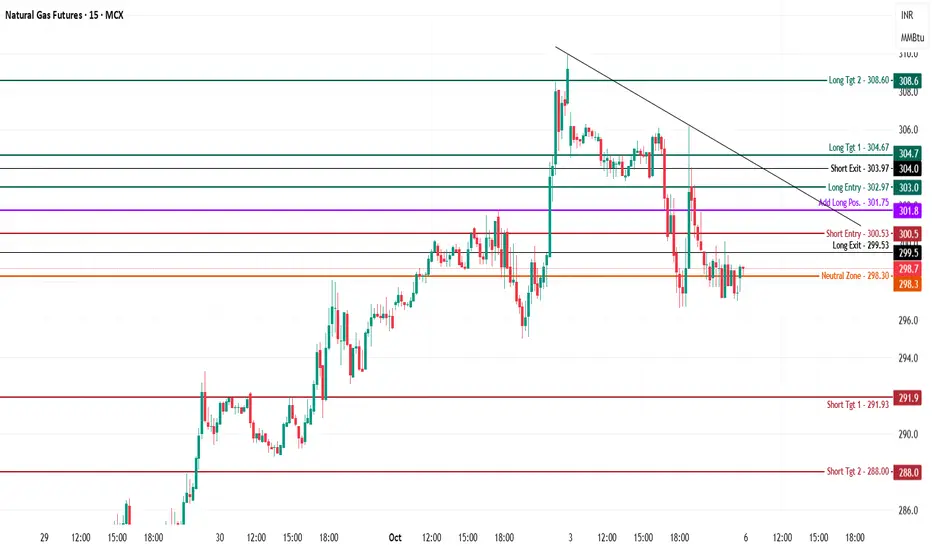
Natural Gas is trading at 298.7, consolidating below recent resistance and major supply after a minor downtrend, with price action holding around the neutral zone and awaiting a directional breakout.
Bullish (Long) Setup
Long Entry (303.0):
Initiate long trades above 303.0, which signals a breakout over the recent resistance and descending trendline, confirming buyers retaking control.
Additional exposure can be added near 301.75 if dips are bought and price forms a higher low.
Upside Targets:
304.7 (Target 1): Immediate supply and intraday high—key zone for partial booking.
308.6 (Target 2): The extended bullish target in case of strong momentum, mapping to higher channel resistance.
Stop Loss:
Place just below 299.5 (long exit level) or 298.3 (neutral zone) to contain risk from false breakouts.
Bearish (Short) Setup
Short Entry (300.5):
Shorts become actionable below 300.5, on sustained failure to reclaim resistance, giving further advantage to sellers.
Downside Targets:
291.9 (Target 1): Previous low and first major support area where covering may occur.
288.0 (Target 2): Deeper extension, marking aggressive selling or stop-loss sweep area.
Stop Loss:
Place above 301.8 (add-long band) to avoid losses on failed breakdowns.
Range/Neutral Logic
Neutral Zone (298.3):
Price consolidating in this area denotes indecision—await a clear breakout or breakdown before committing to trend trades.
Sustained acceptance above 303 confirms bulls; below 299.5 risks further slide.
Technical Chart Analyst
Track: Indian & US Markets
Indices | Commodities | Crypto
Telegram: @ChartPathik for NSE & MCX
& @ChartPathik_Global for US Ins. & Crypto
WhatsApp: +91-99293-91467 for updates.
Track: Indian & US Markets
Indices | Commodities | Crypto
Telegram: @ChartPathik for NSE & MCX
& @ChartPathik_Global for US Ins. & Crypto
WhatsApp: +91-99293-91467 for updates.
Thông báo miễn trừ trách nhiệm
Thông tin và ấn phẩm không có nghĩa là và không cấu thành, tài chính, đầu tư, kinh doanh, hoặc các loại lời khuyên hoặc khuyến nghị khác được cung cấp hoặc xác nhận bởi TradingView. Đọc thêm trong Điều khoản sử dụng.