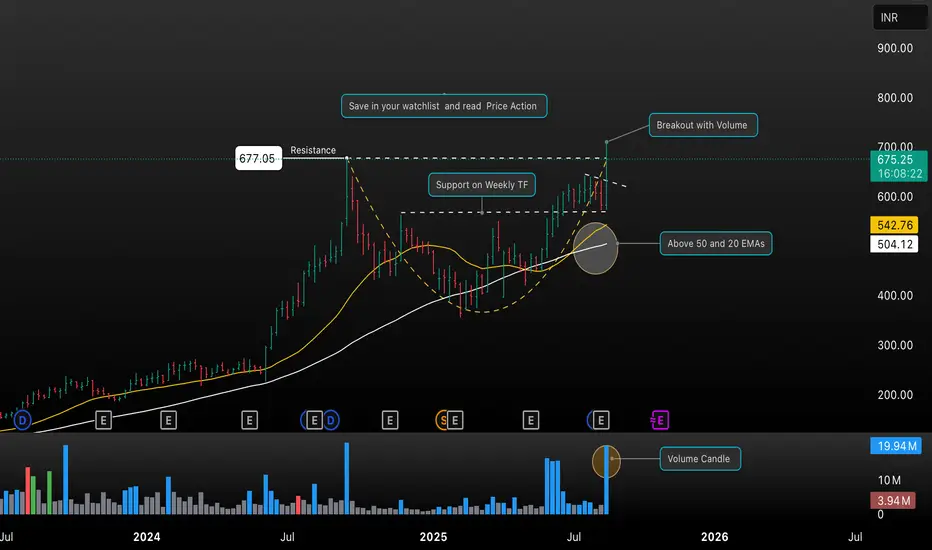
NAVA has showcased a significant bullish breakout on the weekly timeframe, closing above the long-standing resistance at ₹677.05 with a substantial spike in volume. The stock is presently trading above its 20 and 50 EMAs, reaffirming bullish momentum. Key highlights from this setup include:
• Strong resistance breakout with volume confirmation
• Sustained support observed on the weekly timeframe
• Price comfortably holding above crucial 20 EMA (₹542.76) and 50 EMA (₹504.12) levels
• Notable volume candle supporting the move
Add NAVA to your watchlist and closely read upcoming price action for potential continuation or pullback setups. Monitor for further volume and trend confirmation before taking new positions.
This setup is shared for educational purposes; always do your own research before trading or investing.
Thông báo miễn trừ trách nhiệm
Thông tin và ấn phẩm không có nghĩa là và không cấu thành, tài chính, đầu tư, kinh doanh, hoặc các loại lời khuyên hoặc khuyến nghị khác được cung cấp hoặc xác nhận bởi TradingView. Đọc thêm trong Điều khoản sử dụng.
Thông báo miễn trừ trách nhiệm
Thông tin và ấn phẩm không có nghĩa là và không cấu thành, tài chính, đầu tư, kinh doanh, hoặc các loại lời khuyên hoặc khuyến nghị khác được cung cấp hoặc xác nhận bởi TradingView. Đọc thêm trong Điều khoản sử dụng.