📊 Overview
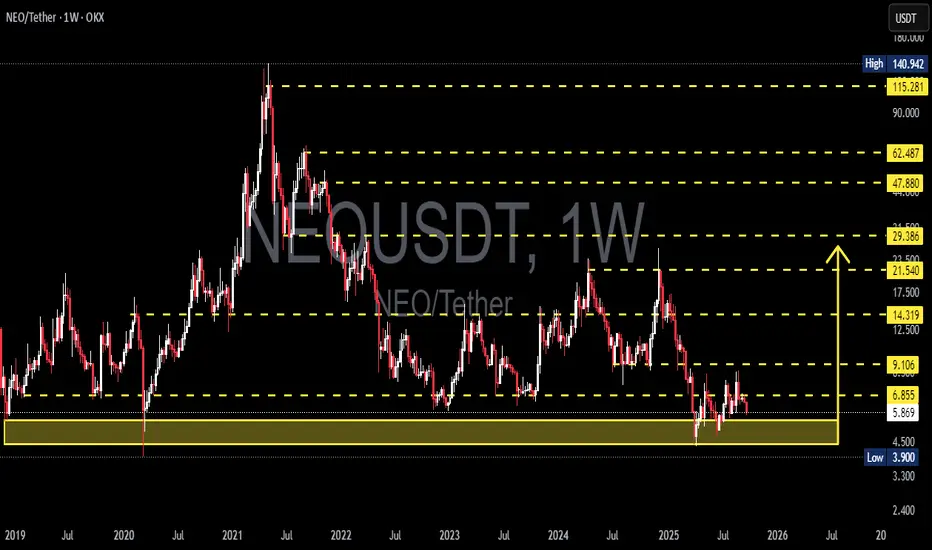
The NEO/USDT (Weekly, OKX) pair is currently sitting at a critical junction that could define its long-term direction. Since the 2021 peak, NEO has been in a macro downtrend, but once again it is testing the historical demand zone at 3.90 – 5.85 USDT (yellow box).
This zone isn’t just a minor support — it’s a multi-year structural level that has repeatedly acted as a floor since 2019.
---
🔍 Structure & Price Pattern
1. Macro Trend:
From the ATH ≈140 USDT (2021), price has consistently formed lower highs and lower lows.
Trend remains bearish, but extended consolidation at the lows suggests possible accumulation.
2. Key Levels:
Strong Support: 3.90 – 5.85 (multi-year demand).
Immediate Resistance: 6.855 USDT.
Next Resistance Levels: 9.106 → 14.319 → 21.540 → 29.386.
Psychological Long-Term Levels: 47.880, 62.487, 115.281, and ATH at 140.942.
3. Potential Patterns:
Holding above the yellow box + breakout over 6.855 could trigger a base breakout / double bottom reversal.
A breakdown below 3.90, however, would confirm a bearish continuation with significant downside risk.
---
🟢 Bullish Scenario
1. Early Confirmation:
Weekly close above 6.855 USDT.
2. Upside Targets:
Target 1: 9.106 USDT.
Target 2: 14.319 USDT.
Target 3: 21.540 USDT (macro structure begins shifting bullish if broken).
3. Supporting Signals:
Strong breakout volume.
RSI reclaiming > 50.
Bullish weekly candlestick closes near the highs.
---
🔴 Bearish Scenario
1. Early Confirmation:
Weekly close below 3.90 USDT.
2. Implications:
Loss of multi-year demand zone.
Opens the door for deeper downside with no clear structural support below.
3. Supporting Signals:
Lower highs failing near 6.855.
RSI staying below 50.
Weak volume on rallies, strong volume on sell-offs.
---
🎯 Conclusion & Sentiment
The 3.90 – 5.85 USDT zone = “Last Defense Zone” for NEO.
Holding this level could spark a long-term reversal toward 9 – 14 USDT.
Breaking below would signal a continuation of the multi-year downtrend with significant downside risk.
At this moment, NEO stands at a crossroad:
➡️ Will it be the start of a new bullish cycle after years of consolidation?
⬅️ Or will it break down its last major support and extend the bearish cycle further?
---
🔑 Notes for Traders
Always wait for weekly close confirmation to avoid bull/bear traps.
Watch the reaction at 3.90 – 5.85 USDT, as it’s critical for both swing traders and long-term investors.
Apply strict risk management (SL/TP), as volatility in this zone can be very high.
---
#NEO #NEOUSDT #NEOAnalysis #Altcoins #CryptoTrading #SwingTrade #SupportResistance #TechnicalAnalysis #CryptoMarket
✅ Get Free Signals! Join Our Telegram Channel Here: t.me/TheCryptoNuclear
✅ Twitter: twitter.com/crypto_nuclear
✅ Join Bybit : partner.bybit.com/b/nuclearvip
✅ Benefits : Lifetime Trading Fee Discount -50%
✅ Twitter: twitter.com/crypto_nuclear
✅ Join Bybit : partner.bybit.com/b/nuclearvip
✅ Benefits : Lifetime Trading Fee Discount -50%
Thông báo miễn trừ trách nhiệm
Thông tin và ấn phẩm không có nghĩa là và không cấu thành, tài chính, đầu tư, kinh doanh, hoặc các loại lời khuyên hoặc khuyến nghị khác được cung cấp hoặc xác nhận bởi TradingView. Đọc thêm trong Điều khoản sử dụng.