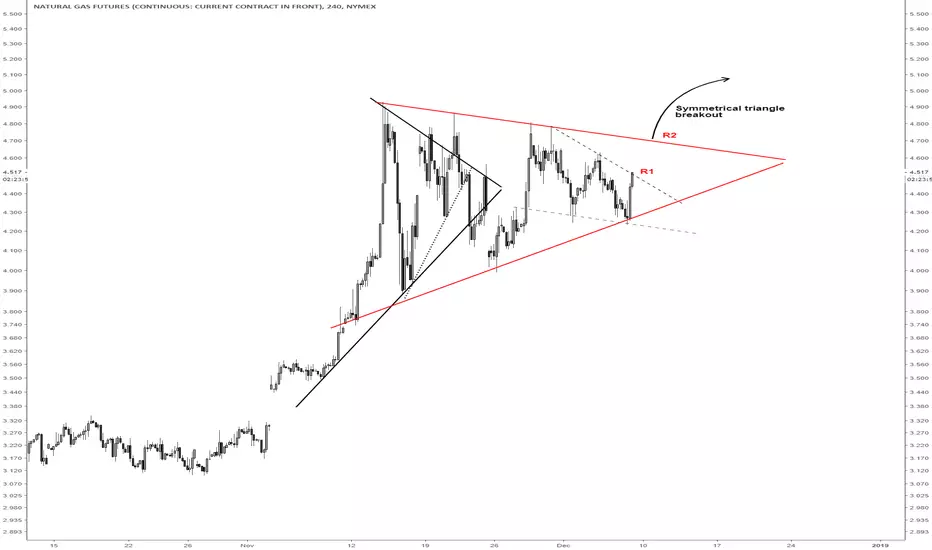
This is a big one, I want this chart in my history. Giant flag/symmetrical triangle.
Warmer Dec than expected and we break down hard! But this is a bullish pattern and continues upwards. Lots of ways to play it, might be wise to just wait for a resolution/breakout first instead of front running.
Warmer Dec than expected and we break down hard! But this is a bullish pattern and continues upwards. Lots of ways to play it, might be wise to just wait for a resolution/breakout first instead of front running.
Ghi chú
UpdateOversold on lower bollinger bands on most time frames up to 12 hr but of course NG can move strongly.
Ghi chú
Updated to include the bull flag spotted by Flapjacks28Ghi chú
Price outside hourly upper bollinger band, price will continue until it finishes its pullback retest to pennant resistance breakdown. Short heavy on the red circle but be diligent about stops.Thông báo miễn trừ trách nhiệm
Thông tin và các ấn phẩm này không nhằm mục đích, và không cấu thành, lời khuyên hoặc khuyến nghị về tài chính, đầu tư, giao dịch hay các loại khác do TradingView cung cấp hoặc xác nhận. Đọc thêm tại Điều khoản Sử dụng.
Thông báo miễn trừ trách nhiệm
Thông tin và các ấn phẩm này không nhằm mục đích, và không cấu thành, lời khuyên hoặc khuyến nghị về tài chính, đầu tư, giao dịch hay các loại khác do TradingView cung cấp hoặc xác nhận. Đọc thêm tại Điều khoản Sử dụng.