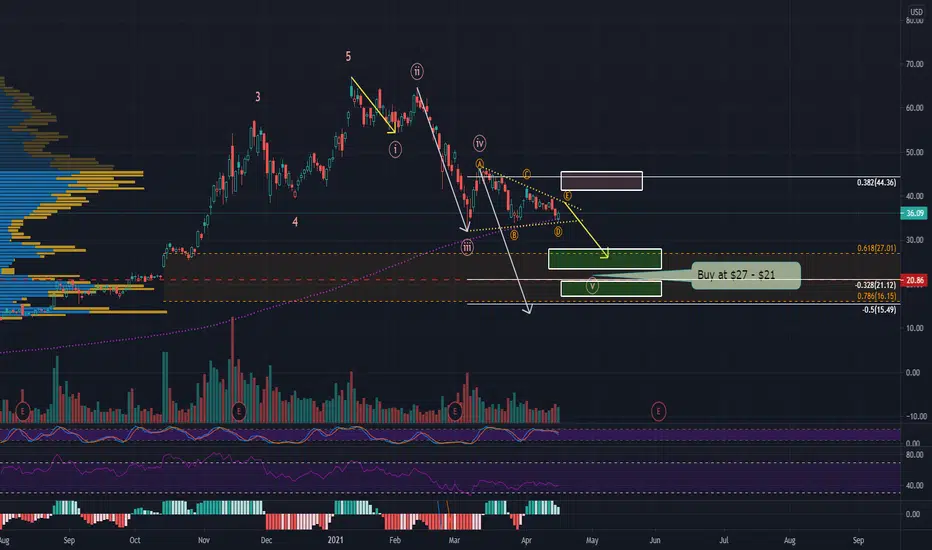
So here's a look at NIO after its run up and ATH in Jan.
The larger degree impulse from about $2 to $67 has a golden zone retrace between $16 and $27 (in orange), and a late august to mid oct resistance-turned-support at around $20 (red dashed line).
If we map out the correction from the Jan high, we get a really clean count with NIO currently being in a ABCDE triangle formation in the downward W4.
An equal legs target of W1 (yellow arrow) leads us to the larger 0.618 retracement at $27 and an equal legs target of W3 (white arrow) leads us just past the 0.786 retracement at $16.15 as well as the -0.5 extension of the current wave 4 at $15.49.
Our previous support/resistance levels lands exactly in the middle at around the $20 mark which is also the -0.382 extension of wave 4.
If NIO can't get above $39, then we are headed to anywhere between $27 and $20, with a deep retrace around $15 (altho this is unlikely imo)
I should note that we are currently hovering above the 200 MA at about $35, and a daily close below that would signal a sell off. The 35-39 zone is crucial here to see which way we go. Right now my money is on a further correction, as the 5 wave down move is not yet complete.
Thông báo miễn trừ trách nhiệm
Thông tin và ấn phẩm không có nghĩa là và không cấu thành, tài chính, đầu tư, kinh doanh, hoặc các loại lời khuyên hoặc khuyến nghị khác được cung cấp hoặc xác nhận bởi TradingView. Đọc thêm trong Điều khoản sử dụng.
Thông báo miễn trừ trách nhiệm
Thông tin và ấn phẩm không có nghĩa là và không cấu thành, tài chính, đầu tư, kinh doanh, hoặc các loại lời khuyên hoặc khuyến nghị khác được cung cấp hoặc xác nhận bởi TradingView. Đọc thêm trong Điều khoản sử dụng.