Overall Idea
(Not financial advice)
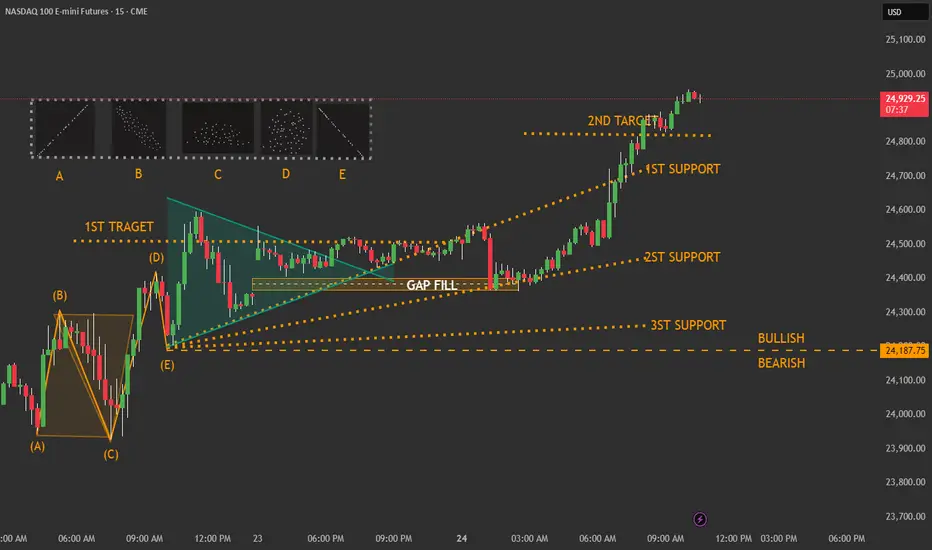
The chart shows a price pattern forming after a strong move upward and downward, followed by a consolidation phase. The diagram highlights targets, supports, and a gap fill area, helping determine bullish vs. bearish scenarios.
Wave Structure (A → E)
(Not financial advice)
On the left side, there's a labeled price swing (A–B–C–D–E).
This represents a sequence of higher-lows and lower-highs, ending at point (E).
Point (E) acts as the base from which the next structure begins.
Triangle Wedge Pattern
(Not financial advice)
Right after point (E), the market forms a tightening triangular structure
Upper descending line seller pressure
Lower ascending line buyer pressure
This pattern shows compression before a larger movement.
Gap Fill Area
(Not financial advice)
The GAP FILL zone inside the triangle marks an area where price previously skipped quickly.
Price often returns to such zones, creating
temporary support
or a magnet before continuation
Price Targets
(Not financial advice)
1ST TARGET
Primary upside objective if price breaks above the triangle.
2ND TARGET
A farther target indicating strong bullish expansion.
Support Levels
(Not financial advice)
1ST SUPPORT
Closest support maintains bullish structure.
2ND SUPPORT
A deeper structural support.
3ST SUPPORT
Strongest support and major turning point.
Bullish vs. Bearish Line
(Not financial advice)
The dashed horizontal line at the bottom marks the key boundary
Above → bullish
Below → bearish
(Not financial advice)
The chart shows a price pattern forming after a strong move upward and downward, followed by a consolidation phase. The diagram highlights targets, supports, and a gap fill area, helping determine bullish vs. bearish scenarios.
Wave Structure (A → E)
(Not financial advice)
On the left side, there's a labeled price swing (A–B–C–D–E).
This represents a sequence of higher-lows and lower-highs, ending at point (E).
Point (E) acts as the base from which the next structure begins.
Triangle Wedge Pattern
(Not financial advice)
Right after point (E), the market forms a tightening triangular structure
Upper descending line seller pressure
Lower ascending line buyer pressure
This pattern shows compression before a larger movement.
Gap Fill Area
(Not financial advice)
The GAP FILL zone inside the triangle marks an area where price previously skipped quickly.
Price often returns to such zones, creating
temporary support
or a magnet before continuation
Price Targets
(Not financial advice)
1ST TARGET
Primary upside objective if price breaks above the triangle.
2ND TARGET
A farther target indicating strong bullish expansion.
Support Levels
(Not financial advice)
1ST SUPPORT
Closest support maintains bullish structure.
2ND SUPPORT
A deeper structural support.
3ST SUPPORT
Strongest support and major turning point.
Bullish vs. Bearish Line
(Not financial advice)
The dashed horizontal line at the bottom marks the key boundary
Above → bullish
Below → bearish
Thông báo miễn trừ trách nhiệm
Thông tin và các ấn phẩm này không nhằm mục đích, và không cấu thành, lời khuyên hoặc khuyến nghị về tài chính, đầu tư, giao dịch hay các loại khác do TradingView cung cấp hoặc xác nhận. Đọc thêm tại Điều khoản Sử dụng.
Thông báo miễn trừ trách nhiệm
Thông tin và các ấn phẩm này không nhằm mục đích, và không cấu thành, lời khuyên hoặc khuyến nghị về tài chính, đầu tư, giao dịch hay các loại khác do TradingView cung cấp hoặc xác nhận. Đọc thêm tại Điều khoản Sử dụng.