Hello traders!
We want to share with you pretty clear and recognizable pattern on Nasdaq! According to correlations with other stocks, we assume that stocks may face a hard drop.
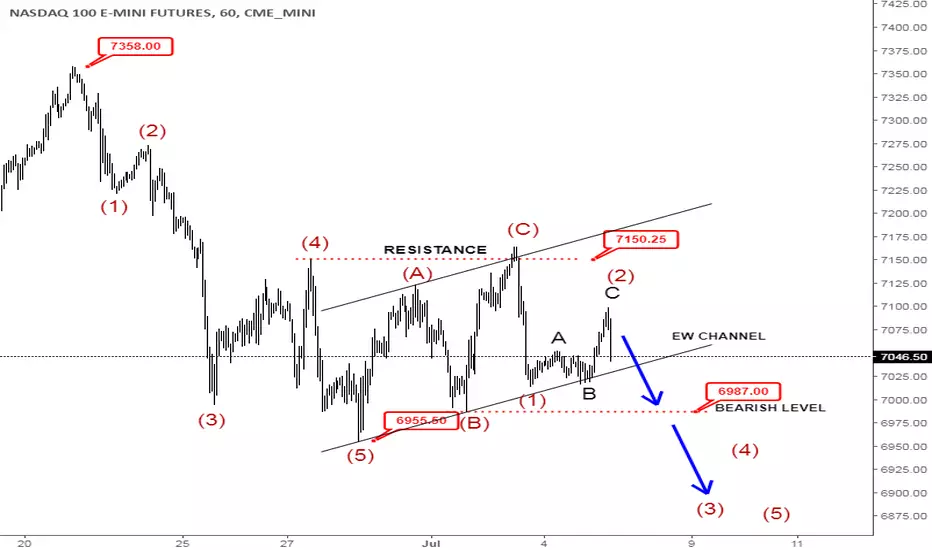
We can clearly count five waves down from 7358 highs, which suggest a bearish reversal, but the most important is that we see only three waves (A)-(B)-(C) of corrective recovery back to ideal resistance at previous wave (4) around 7150 level. In EW theory, impulsive five waves down and corrective three waves up indicate a bearish trend.
As you can see, Nasdaq already sharply dropped from 7150 resistance area and currently can be just consolidating before a continuation lower towards new lows, especially if breaks below EW channel support line and 6987 bearish confirmation level, which would confirm our view.
Even if turns back above 7150 level, we will still tracking a correction, but just more complex, so we remain bearish as long as it's trading below 7358 invalidation level.
We want to share with you pretty clear and recognizable pattern on Nasdaq! According to correlations with other stocks, we assume that stocks may face a hard drop.
We can clearly count five waves down from 7358 highs, which suggest a bearish reversal, but the most important is that we see only three waves (A)-(B)-(C) of corrective recovery back to ideal resistance at previous wave (4) around 7150 level. In EW theory, impulsive five waves down and corrective three waves up indicate a bearish trend.
As you can see, Nasdaq already sharply dropped from 7150 resistance area and currently can be just consolidating before a continuation lower towards new lows, especially if breaks below EW channel support line and 6987 bearish confirmation level, which would confirm our view.
Even if turns back above 7150 level, we will still tracking a correction, but just more complex, so we remain bearish as long as it's trading below 7358 invalidation level.
Ghi chú
We warned about complex correction: "Even if turns back above 7150 level, we will still tracking a correction, but just more complex, so we remain bearish as long as it's trading below 7358 invalidation level."Update:
Ghi chú
Nasdaq made an impulsive rise back to a second resistance at previous wave (2) right around 78,6% Fibo. retracement, so still can be a deeper correction, but for now we are just stracking it and if we get a sharp drop back below 7100, only then we may consider a bearish reversal.US Single STOCKS (FREE Access), FX, Crypto
7 DAY TRIAL: testwt7
👉Explore Our Services with @ wavetraders.com/elliott-wave-plans/
Learn Elliott Waves
👉 wavetraders.com/academy/
Newsletter Sign up
👉 bit.ly/3FVPVzO
7 DAY TRIAL: testwt7
👉Explore Our Services with @ wavetraders.com/elliott-wave-plans/
Learn Elliott Waves
👉 wavetraders.com/academy/
Newsletter Sign up
👉 bit.ly/3FVPVzO
Bài đăng liên quan
Thông báo miễn trừ trách nhiệm
Thông tin và ấn phẩm không có nghĩa là và không cấu thành, tài chính, đầu tư, kinh doanh, hoặc các loại lời khuyên hoặc khuyến nghị khác được cung cấp hoặc xác nhận bởi TradingView. Đọc thêm trong Điều khoản sử dụng.
US Single STOCKS (FREE Access), FX, Crypto
7 DAY TRIAL: testwt7
👉Explore Our Services with @ wavetraders.com/elliott-wave-plans/
Learn Elliott Waves
👉 wavetraders.com/academy/
Newsletter Sign up
👉 bit.ly/3FVPVzO
7 DAY TRIAL: testwt7
👉Explore Our Services with @ wavetraders.com/elliott-wave-plans/
Learn Elliott Waves
👉 wavetraders.com/academy/
Newsletter Sign up
👉 bit.ly/3FVPVzO
Bài đăng liên quan
Thông báo miễn trừ trách nhiệm
Thông tin và ấn phẩm không có nghĩa là và không cấu thành, tài chính, đầu tư, kinh doanh, hoặc các loại lời khuyên hoặc khuyến nghị khác được cung cấp hoặc xác nhận bởi TradingView. Đọc thêm trong Điều khoản sử dụng.