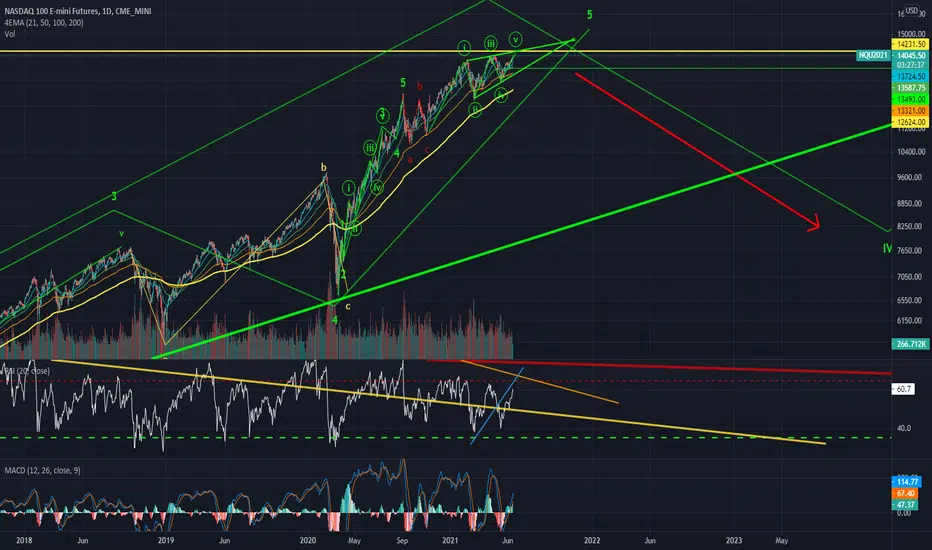
Tracking this formation as an ending diagonal.
This might be THE ending diagonal.
The ending point can be a higher high or lower one.
Many times you'll see a bump up above the top of the diagonal before it crashes back through.
*Note: This is the exact same formation Bitcoin had a few months ago before it crashed 50%. The relation is palpable.
I see Bitcoin as the honest player in the game as far as price action and patterns go. Look at the two charts.
Diagonal remains valid unless be break above 15,000.
Ghi chú
Thông báo miễn trừ trách nhiệm
Thông tin và ấn phẩm không có nghĩa là và không cấu thành, tài chính, đầu tư, kinh doanh, hoặc các loại lời khuyên hoặc khuyến nghị khác được cung cấp hoặc xác nhận bởi TradingView. Đọc thêm trong Điều khoản sử dụng.
Thông báo miễn trừ trách nhiệm
Thông tin và ấn phẩm không có nghĩa là và không cấu thành, tài chính, đầu tư, kinh doanh, hoặc các loại lời khuyên hoặc khuyến nghị khác được cung cấp hoặc xác nhận bởi TradingView. Đọc thêm trong Điều khoản sử dụng.