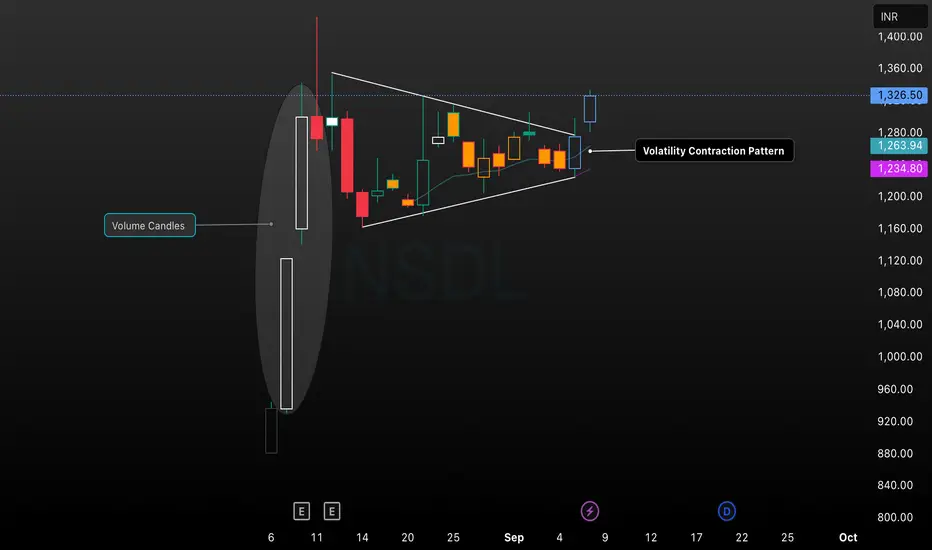
This chart displays the NSDL stock price on a daily timeframe, featuring a classic Volatility Contraction Pattern (VCP) after a surge in volume and price. The consolidation phase is marked by converging trendlines, with price contracting and forming tighter ranges. The recent breakout above the upper trendline signals renewed bullish momentum. Volume candles accentuate the initial surge, and key support/resistance levels are noted. This technical setup is ideal for traders seeking entries based on volatility contraction and breakout strategies.
Thông báo miễn trừ trách nhiệm
Thông tin và ấn phẩm không có nghĩa là và không cấu thành, tài chính, đầu tư, kinh doanh, hoặc các loại lời khuyên hoặc khuyến nghị khác được cung cấp hoặc xác nhận bởi TradingView. Đọc thêm trong Điều khoản sử dụng.
Thông báo miễn trừ trách nhiệm
Thông tin và ấn phẩm không có nghĩa là và không cấu thành, tài chính, đầu tư, kinh doanh, hoặc các loại lời khuyên hoặc khuyến nghị khác được cung cấp hoặc xác nhận bởi TradingView. Đọc thêm trong Điều khoản sử dụng.