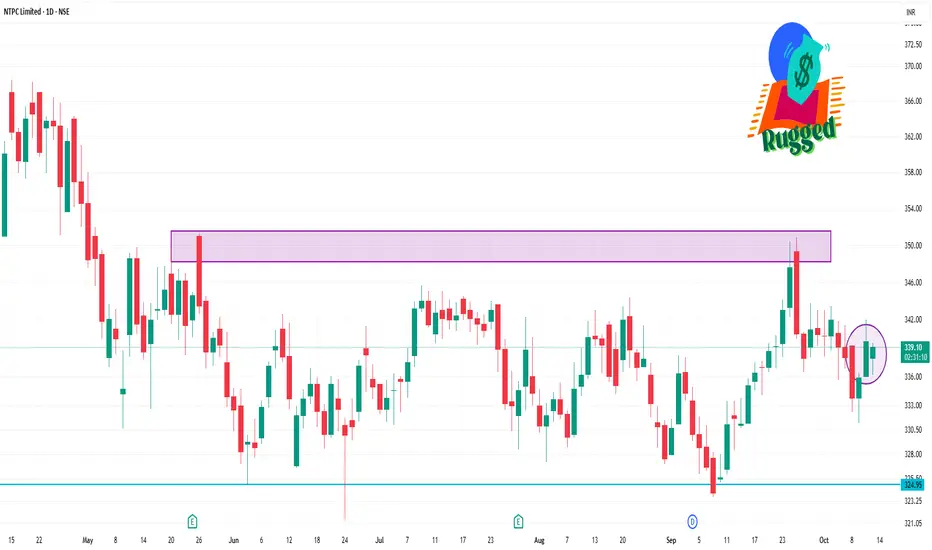
📈 Intraday Support & Resistance Levels
Immediate Support: ₹337.29
Immediate Resistance: ₹340.85
Key Pivot Point: ₹339.20
These levels are derived from standard pivot point calculations and are commonly used by traders for short-term strategies.
🔍 Technical Indicators
Relative Strength Index (RSI): 53.93 — indicating a neutral market condition.
Moving Average Convergence Divergence (MACD): 0.330 — suggesting a bullish trend.
5-Day Moving Average: ₹338.45 — supporting a bullish outlook.
50-Day Moving Average: ₹338.05 — reinforcing the bullish trend.
200-Day Moving Average: ₹336.12 — indicating long-term bullish sentiment.
Bài đăng liên quan
Thông báo miễn trừ trách nhiệm
Thông tin và ấn phẩm không có nghĩa là và không cấu thành, tài chính, đầu tư, kinh doanh, hoặc các loại lời khuyên hoặc khuyến nghị khác được cung cấp hoặc xác nhận bởi TradingView. Đọc thêm trong Điều khoản sử dụng.
Bài đăng liên quan
Thông báo miễn trừ trách nhiệm
Thông tin và ấn phẩm không có nghĩa là và không cấu thành, tài chính, đầu tư, kinh doanh, hoặc các loại lời khuyên hoặc khuyến nghị khác được cung cấp hoặc xác nhận bởi TradingView. Đọc thêm trong Điều khoản sử dụng.