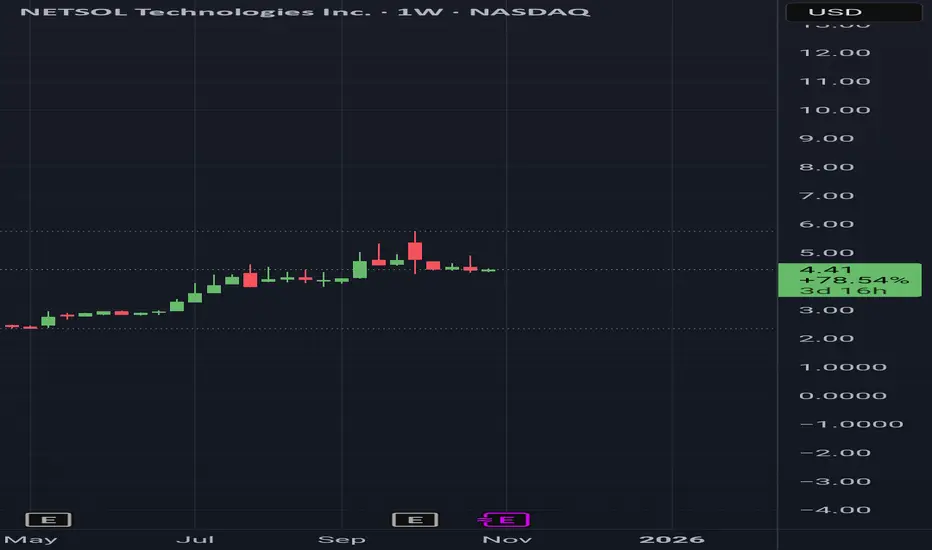
NETSOL TECHNOLOGY (NASDAQ)
The yearly pattern has been bullish since January, this pattern is very important, if it breaks, a new one will likely develop around 2029, (No support found).
The half yearly pattern has been bullish since January 2024, with one support noted at $2.15.
The quarterly pattern is almost bullish, the next green quarterly candle will indicate a bullish trend, above $5.80, the structure will remains bullish, (No support found).
The monthly pattern will be bullish in December, January, two supports are noted at $2.40 and $2.09.
The weekly pattern is bullish but at the wrong place, another weekly bullish pattern needs to form, three supports are noted at $4.00, $2.96, and $2.26.
If the yearly pattern stays bullish, the above resistances are noted to be tested at $7.00, $10.00, $11.40, $15.20, and it could likely reach $27.60.
The quarterly resistances are noted to be tested at $10.10, $11.70, and $20.00.
The monthly major resistances are noted to be tested at $12.10, $21.60, and $23.00.
The weekly resistances are noted to be tested at $6.61, $10.53, $13.74, $20.30, and $58.60.
Overall, bearish market supports are noted at $1.52 and $1.17.
Disclaimer, This message is for educational purposes only,
Always DYOR,
Note, TradingView doesn't allow me to share my technical analysis chart,
Thông báo miễn trừ trách nhiệm
Thông tin và ấn phẩm không có nghĩa là và không cấu thành, tài chính, đầu tư, kinh doanh, hoặc các loại lời khuyên hoặc khuyến nghị khác được cung cấp hoặc xác nhận bởi TradingView. Đọc thêm trong Điều khoản sử dụng.
Thông báo miễn trừ trách nhiệm
Thông tin và ấn phẩm không có nghĩa là và không cấu thành, tài chính, đầu tư, kinh doanh, hoặc các loại lời khuyên hoặc khuyến nghị khác được cung cấp hoặc xác nhận bởi TradingView. Đọc thêm trong Điều khoản sử dụng.