Hi guys,
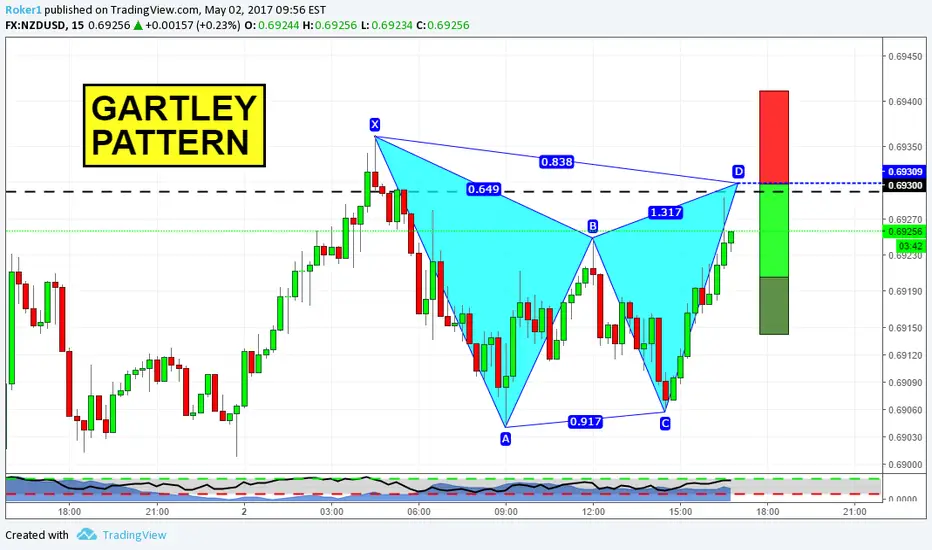
here on the chart you can see 15m timeframe on NZDUSD. This Gartley lines up pretty well with a former structure level that could act as resistance now. Therefore, the likelihood of this trade is increased by that. Stops above X, targets as usual for harmonics.
If you have questions, or if you want to share your view, feel free to comment below.
Otherwise, see you in the next chart!
Đóng lệnh: dừng lỗ
Small loss hereThông báo miễn trừ trách nhiệm
Thông tin và các ấn phẩm này không nhằm mục đích, và không cấu thành, lời khuyên hoặc khuyến nghị về tài chính, đầu tư, giao dịch hay các loại khác do TradingView cung cấp hoặc xác nhận. Đọc thêm tại Điều khoản Sử dụng.
Thông báo miễn trừ trách nhiệm
Thông tin và các ấn phẩm này không nhằm mục đích, và không cấu thành, lời khuyên hoặc khuyến nghị về tài chính, đầu tư, giao dịch hay các loại khác do TradingView cung cấp hoặc xác nhận. Đọc thêm tại Điều khoản Sử dụng.