Hello, traders. Nice to meet you.
If you "Follow," you'll always get the latest information quickly.
Have a great day.
-------------------------------------
(ONDOUSDT 1W Chart)
The key is whether the price can find support near 0.832 and rise above the M-Signal indicator on the 1W chart.
The resistance zone is 1.27231-1.61427.
If it falls below 0.832, you should stop trading and wait and see how things go.
-
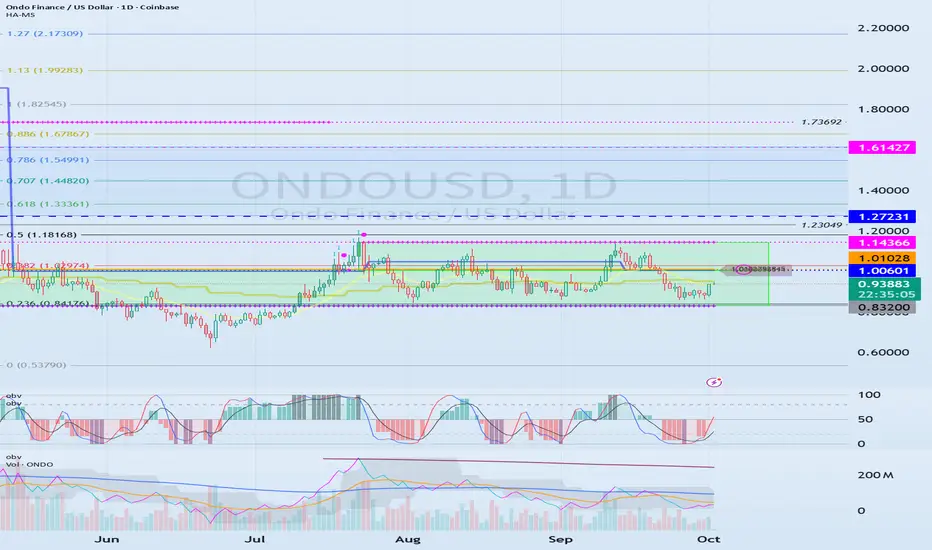
(1D Chart)
The key is whether the price can rise above the 1.00601-1.14366 range, which is the HA-Low and HA-High indicators.
The HA-High ~ DOM (60) range is formed within the 1.00601-1.14366 range, so if this range breaks upward, a step-up trend is likely.
However, the resistance zone on the 1W chart is located at 1.27231-1.61427, so the trend will ultimately be determined by whether support is found within this range.
What we can do is buy in the 0.832-1.14366 range and sell in the 1.27231-1.61427 range.
The reference range for buying is 1.00601-1.01028.
-
Thank you for reading.
We wish you successful trading.
--------------------------------------------------
※ Follow X to check out the posts.
※ X를 팔로우하고 게시물을 확인하세요.
◆ t.me/readCryptoChannel
[HA-MS Indicator]
bit.ly/3YxHgvN
[OBV Indicator]
bit.ly/4dcyny3
※ X를 팔로우하고 게시물을 확인하세요.
◆ t.me/readCryptoChannel
[HA-MS Indicator]
bit.ly/3YxHgvN
[OBV Indicator]
bit.ly/4dcyny3
Bài đăng liên quan
Thông báo miễn trừ trách nhiệm
Thông tin và các ấn phẩm này không nhằm mục đích, và không cấu thành, lời khuyên hoặc khuyến nghị về tài chính, đầu tư, giao dịch hay các loại khác do TradingView cung cấp hoặc xác nhận. Đọc thêm tại Điều khoản Sử dụng.