🟡 Chart Structure
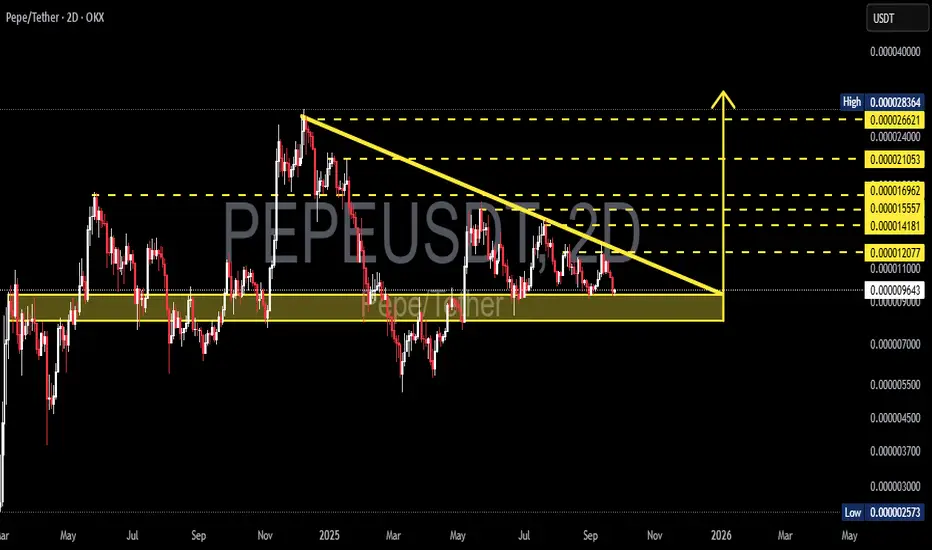
PEPE is currently in a critical phase. The price has been forming a descending triangle (lower highs + horizontal support) for several months.
Current price: 0.000009638
Major Support Zone: 0.000007000 – 0.000011100 (yellow box)
Key Downtrend Resistance: descending yellow trendline from 2025 highs
Upside Levels: 0.000012077 → 0.000014181 → 0.000015557 → 0.000016962 → 0.000021053 → 0.000024000 → 0.000026621
Extreme Low: 0.000002573
---
🟢 Bullish Scenario — The Big Breakout
If PEPE breaks above the downtrend line and closes above 0.000012077 with strong volume, then:
1. The descending triangle breakout will be confirmed.
2. Measured Move Target:
Pattern height = (High 0.000028364 − Support 0.000009638) = 0.000018726
Added to breakout level (0.000012077 + 0.000018726) = 0.000030803
Potential upside: +220% from current levels.
3. Likely progression step by step:
Short-term resistance: 0.000014 – 0.000017
Next milestones: 0.000021 – 0.000024 → 0.000026+ toward the final target.
4. If confirmed, this could be one of the strongest rallies of the year for PEPE.
---
🔴 Bearish Scenario — Breakdown Risk
Statistically, descending triangles tend to lean bearish. If the yellow support zone (0.000007000 – 0.000009000) breaks with volume, then:
1. The structure fails and selling pressure accelerates.
2. Downside targets:
0.000005000 → 0.000003000 → extreme low at 0.000002573.
3. From current price to 0.000002573 = -73% downside risk.
4. Failure to hold support could trigger a sharp continuation of the bearish trend.
---
📐 Technical Pattern — Descending Triangle
Meaning: sellers keep pushing lower highs, while buyers defend one horizontal area.
Bias: bearish continuation by default.
But… if bulls break the trendline, it flips into a powerful bullish reversal signal → often followed by rapid rallies.
---
🧠 Key Notes for Traders
Don’t enter trades just because price touches support or resistance → always wait for a 2D candle close + volume confirmation.
Breakout: avoid FOMO, wait for a retest of the breakout area for a safer entry.
Breakdown: avoid holding longs → prepare for deeper support tests.
Risk management is crucial: use stop-loss and proper position sizing.
---
✨ Conclusion
PEPE is at a major crossroads:
Breakout → upside potential to 0.000030803 (+220%).
Breakdown → downside risk to the historical low around 0.000002573 (−73%).
This is not just sideways consolidation — it’s a decision zone that could define PEPE’s next big move for the months ahead. Traders should be prepared for both scenarios with strict discipline.
---
#PEPE #PEPEUSDT #Crypto #Altcoins #TechnicalAnalysis #Breakout #SupportResistance #DescendingTriangle #CryptoTrading
✅ Get Free Signals! Join Our Telegram Channel Here: t.me/TheCryptoNuclear
✅ Twitter: twitter.com/crypto_nuclear
✅ Join Bybit : partner.bybit.com/b/nuclearvip
✅ Benefits : Lifetime Trading Fee Discount -50%
✅ Twitter: twitter.com/crypto_nuclear
✅ Join Bybit : partner.bybit.com/b/nuclearvip
✅ Benefits : Lifetime Trading Fee Discount -50%
Thông báo miễn trừ trách nhiệm
Thông tin và ấn phẩm không có nghĩa là và không cấu thành, tài chính, đầu tư, kinh doanh, hoặc các loại lời khuyên hoặc khuyến nghị khác được cung cấp hoặc xác nhận bởi TradingView. Đọc thêm trong Điều khoản sử dụng.