Overview:
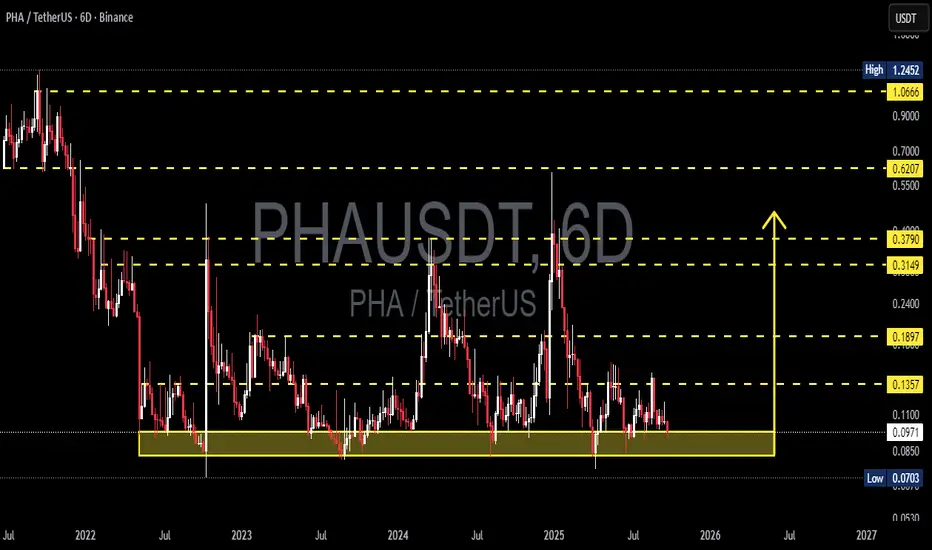
PHA/USDT has been in a long downtrend since its 2021 peak. However, since mid-2022, price action has consistently formed a multi-year base around the 0.07 – 0.10 USDT demand zone (yellow box). This level has been tested several times, yet buyers continue to defend it, signaling strong accumulation interest.
Each dip into this zone has resulted in sharp rebounds toward the 0.30–0.38 region, though rallies have failed to sustain. This highlights that the market is still in a waiting phase, seeking a strong catalyst before confirming a major breakout.
---
Key Technical Levels
Primary Support (Demand Zone): 0.070 – 0.097
Step-by-Step Resistances:
0.1357 → first breakout confirmation level
0.1897 → psychological barrier and potential rejection zone
0.3149 – 0.3790 → strong mid-term resistance cluster
0.6207 → major resistance, previous heavy supply zone
1.0666 – 1.2452 → long-term bullish targets if a full market cycle develops
---
Pattern & Market Structure
Current Formation: Accumulation Range (0.07 – 0.10)
Price Action: Long lower wicks at support show repeated liquidity grabs and aggressive buyer re-entries.
Conclusion: Market is consolidating sideways, building a potential base for the next major trend.
---
Bullish Scenario
1. Trigger: A decisive 6D close above 0.1357 with strong volume.
2. Upside Targets:
Target 1 → 0.1897
Target 2 → 0.3149
Target 3 → 0.3790
With strong momentum, expansion toward 0.62 – 1.06 is possible.
3. Catalyst: A broader crypto market uptrend could fuel a breakout from this prolonged consolidation.
---
Bearish Scenario
1. Trigger: A 6D close below 0.0703 → breakdown of the multi-year demand zone.
2. Risk: Opens the door to new lows with potential panic selling.
3. Outcome: Such a breakdown often leads to a “capitulation bottom” before recovery.
---
Investor & Trader Perspective
Long-Term Investors: The 0.07–0.10 zone offers one of the best risk-reward opportunities for gradual accumulation, but patience and volatility tolerance are required.
Short-Term Traders: Range trading works well here → buy near demand, sell near 0.135–0.19 with tight risk management.
Trend Confirmation: Only a breakout above 0.1357 with volume validates a healthier bullish structure.
---
Conclusion
PHA is currently at one of the most critical turning points in its price history.
If the 0.07–0.10 demand zone continues to hold, it could serve as the launchpad for the next major rally.
But if it breaks down, PHA may face a deep bearish extension toward uncharted lows.
In short: PHA is standing at a crossroads — either the beginning of a new bullish chapter, or a descent into capitulation.
---
#PHA #PHAUSDT #CryptoAnalysis #Altcoin #PriceAction #SupportResistance #CryptoTrading #Accumulation #BreakoutSetup #RiskManagement
✅ Get Free Signals! Join Our Telegram Channel Here: t.me/TheCryptoNuclear
✅ Twitter: twitter.com/crypto_nuclear
✅ Join Bybit : partner.bybit.com/b/nuclearvip
✅ Benefits : Lifetime Trading Fee Discount -50%
✅ Twitter: twitter.com/crypto_nuclear
✅ Join Bybit : partner.bybit.com/b/nuclearvip
✅ Benefits : Lifetime Trading Fee Discount -50%
Thông báo miễn trừ trách nhiệm
Thông tin và ấn phẩm không có nghĩa là và không cấu thành, tài chính, đầu tư, kinh doanh, hoặc các loại lời khuyên hoặc khuyến nghị khác được cung cấp hoặc xác nhận bởi TradingView. Đọc thêm trong Điều khoản sử dụng.