Here’s a summary of the latest intraday data:
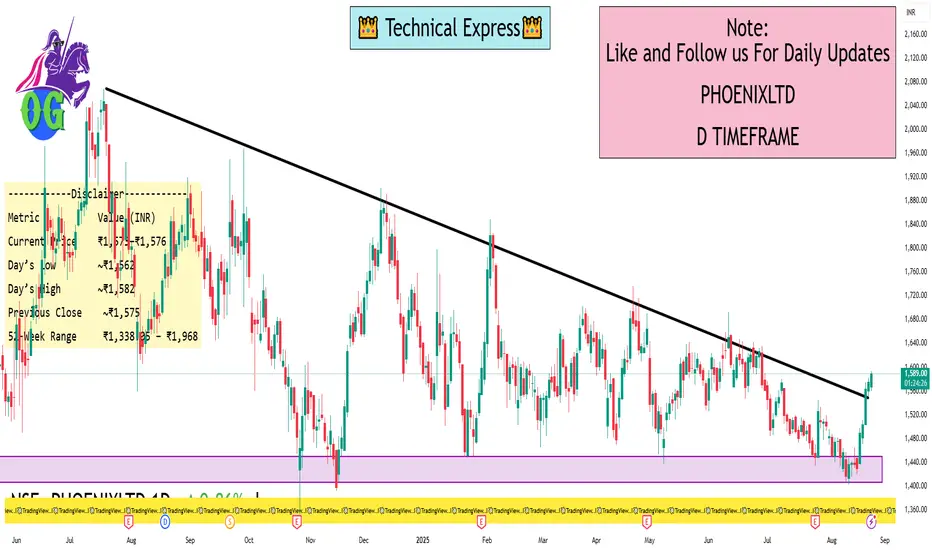
Current price: Approximately ₹1,573.00–₹1,576.00
Daily range: Between ₹1,562.00 (low) and ₹1,582.50 (high)
Previous closing price: Around ₹1,575.50
52-week range: ₹1,338.05 — ₹1,968.00
Specifically:
TradingView reports a current price of ₹1,575.50, showing a gain of ~0.76% in the last 24 hours. Day’s range is consistent with ₹1,562.00–₹1,582.50
Screener shows the price at ₹1,573 as of 10:44 a.m. IST today
Investing.com indicates the stock is trading at ₹1,575.50, with day’s range and 52-week range matching other sources
Financial Times Markets Data confirms intraday trading between ₹1,560.40 and ₹1,582.50, with previous close at₹1,575.00
Suggested Next Steps
Charting Platforms – Sites like TradingView, Investing.com, or Moneycontrol offer real-time intraday charts. These let you analyze key levels such as open, high, low, VWAP, and volume trends.
Technical Indicators – To identify support and resistance, you might want to apply indicators like moving averages (e.g., 20/50 EMA), RSI, or VWAP.
Alerts and Watchlists – Set price alerts around critical levels (e.g., ₹1,562 or ₹1,582) to stay informed of key moves.
Volume Analysis – Intraday volume can confirm the strength behind any move—higher volume on breakouts or dips is particularly telling.
I built a Buy & Sell Signal Indicator with 85% accuracy.
📈 Get access via DM or
WhatsApp: wa.link/d997q0
Contact - +91 76782 40962
| Email: techncialexpress@gmail.com
| Script Coder | Trader | Investor | From India
📈 Get access via DM or
WhatsApp: wa.link/d997q0
Contact - +91 76782 40962
| Email: techncialexpress@gmail.com
| Script Coder | Trader | Investor | From India
Bài đăng liên quan
Thông báo miễn trừ trách nhiệm
Thông tin và các ấn phẩm này không nhằm mục đích, và không cấu thành, lời khuyên hoặc khuyến nghị về tài chính, đầu tư, giao dịch hay các loại khác do TradingView cung cấp hoặc xác nhận. Đọc thêm tại Điều khoản Sử dụng.