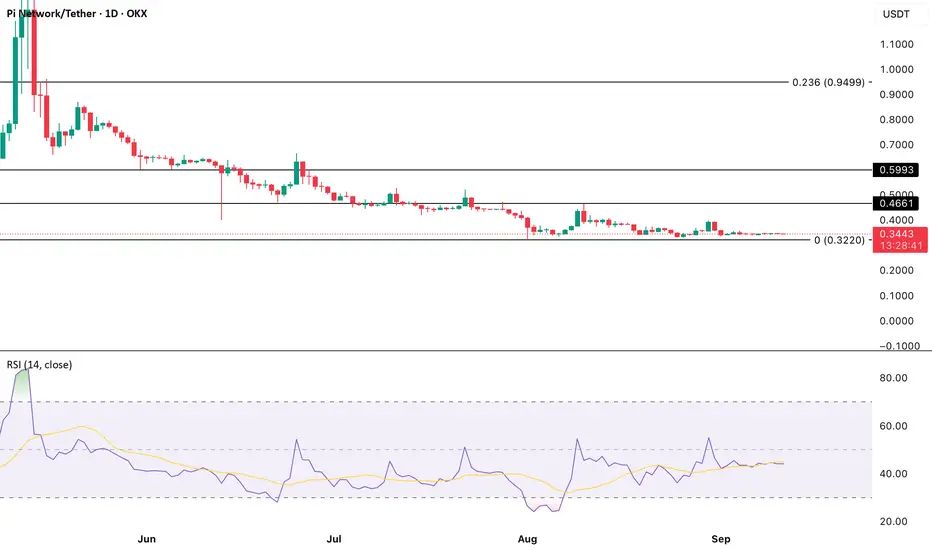
The PI spot market has struggled to show momentum since early September, a trend reflected in its Relative Strength Index (RSI). On the PI/USD daily chart, the RSI has remained flat.
The RSI measures overbought and oversold conditions on a scale of 0–100. Levels above 70 suggest overbought conditions and potential downside, while values below 30 point to oversold territory and possible recovery. With PI hovering near the midline, neither scenario is in play.
A flat RSI highlights a balance between buying and selling pressure, suggesting that neither bulls nor bears are in control. This equilibrium points to muted volatility. Unless momentum picks up, PI’s price is likely to stay constrained within its current narrow range.
Truly Unbiased Cryptocurrency News beincrypto.com
Thông báo miễn trừ trách nhiệm
Thông tin và ấn phẩm không có nghĩa là và không cấu thành, tài chính, đầu tư, kinh doanh, hoặc các loại lời khuyên hoặc khuyến nghị khác được cung cấp hoặc xác nhận bởi TradingView. Đọc thêm trong Điều khoản sử dụng.
Truly Unbiased Cryptocurrency News beincrypto.com
Thông báo miễn trừ trách nhiệm
Thông tin và ấn phẩm không có nghĩa là và không cấu thành, tài chính, đầu tư, kinh doanh, hoặc các loại lời khuyên hoặc khuyến nghị khác được cung cấp hoặc xác nhận bởi TradingView. Đọc thêm trong Điều khoản sử dụng.