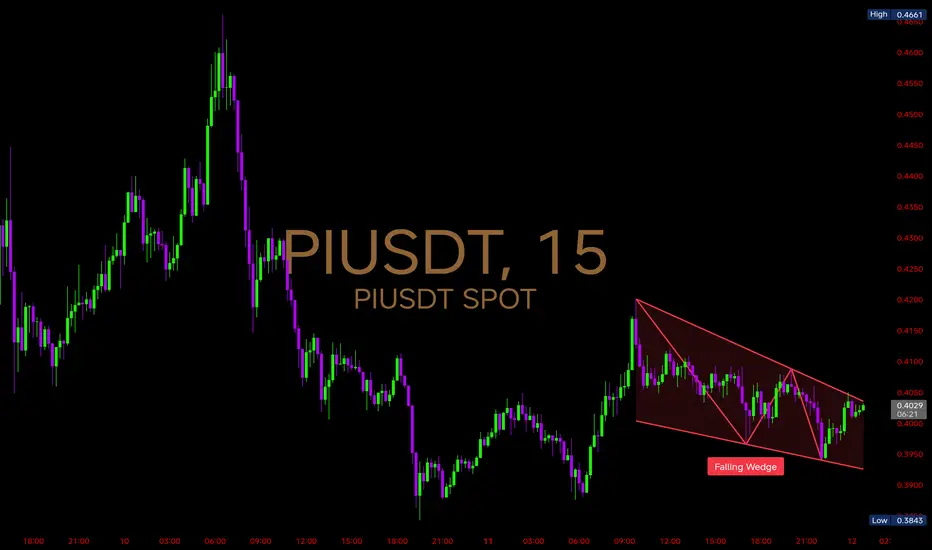
Price is currently trading inside a falling wedge — a pattern often seen as a bullish reversal setup when confirmed with a breakout.
🔍 Key Observations:
Price is compressing between lower highs & higher lows within the wedge
Current range: 0.3843 (low) to 0.4050 (upper wedge resistance)
Breakout confirmation would require a close above 0.4100, ideally with volume expansion
Support at 0.3950 remains key for wedge integrity — losing it could delay reversal potential
📈 Probable Scenarios:
Bullish Case: Breakout above 0.4100 triggers short-term relief rally, potentially retesting 0.4200 zone
Bearish Case: Breakdown below 0.3950 could invalidate wedge and resume the corrective leg
This wedge could mark the early signs of seller exhaustion. Watch for breakout confirmation before anticipating stronger upside momentum.
Thông báo miễn trừ trách nhiệm
Thông tin và các ấn phẩm này không nhằm mục đích, và không cấu thành, lời khuyên hoặc khuyến nghị về tài chính, đầu tư, giao dịch hay các loại khác do TradingView cung cấp hoặc xác nhận. Đọc thêm tại Điều khoản Sử dụng.
Thông báo miễn trừ trách nhiệm
Thông tin và các ấn phẩm này không nhằm mục đích, và không cấu thành, lời khuyên hoặc khuyến nghị về tài chính, đầu tư, giao dịch hay các loại khác do TradingView cung cấp hoặc xác nhận. Đọc thêm tại Điều khoản Sử dụng.