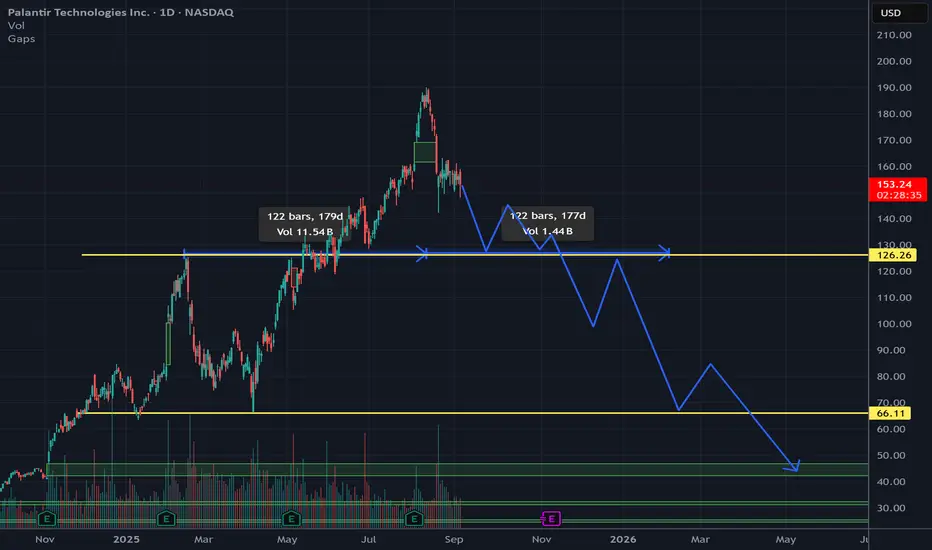
Over 180 days, PLTR climbed aggressively, fueled by high conviction buying. With candlesticks showing strong green bodies and upside momentum, peaking near the $190 52-week high.
This analysis focuses on the fractal comparison in the chart, forecasting an extended bearish phase that could drag the stock significantly lower before any stabilization.
I predict PLTR enters an extended correction phase. This fractal symmetry suggests the downside could match or exceed the prior upside's duration and magnitude, projecting a measured move toward $65 or lower
Thông báo miễn trừ trách nhiệm
Thông tin và ấn phẩm không có nghĩa là và không cấu thành, tài chính, đầu tư, kinh doanh, hoặc các loại lời khuyên hoặc khuyến nghị khác được cung cấp hoặc xác nhận bởi TradingView. Đọc thêm trong Điều khoản sử dụng.
Thông báo miễn trừ trách nhiệm
Thông tin và ấn phẩm không có nghĩa là và không cấu thành, tài chính, đầu tư, kinh doanh, hoặc các loại lời khuyên hoặc khuyến nghị khác được cung cấp hoặc xác nhận bởi TradingView. Đọc thêm trong Điều khoản sử dụng.