📊 Key Technical Indicators
Relative Strength Index (RSI): The 14-day RSI is approximately 59.6, suggesting the stock is neither overbought nor oversold, indicating a neutral stance.
Moving Averages:
20-day Simple Moving Average (SMA): 113.73 (bullish)
50-day SMA: 113.61 (bullish)
200-day SMA: 113.87 (bearish)
20-day Exponential Moving Average (EMA): 113.75 (bullish)
50-day EMA: 113.66 (bullish)
200-day EMA: 113.97 (bearish)
Moving Average Convergence Divergence (MACD): The MACD is positive, indicating bullish momentum.
Commodity Channel Index (CCI): The CCI is at 462.41, which is considered extremely overbought, suggesting potential for a pullback.
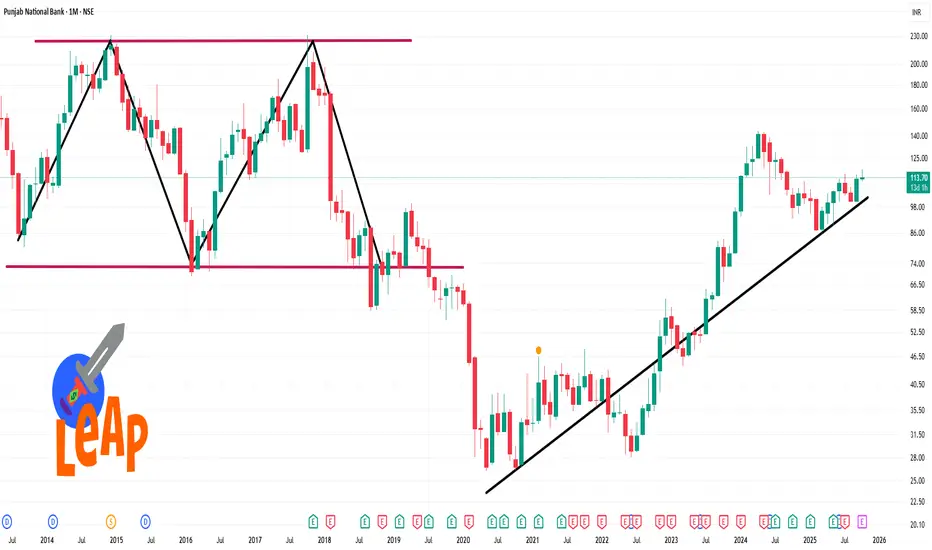
🔍 Support and Resistance Levels
Resistance: 117.24
Support: 111.4
Relative Strength Index (RSI): The 14-day RSI is approximately 59.6, suggesting the stock is neither overbought nor oversold, indicating a neutral stance.
Moving Averages:
20-day Simple Moving Average (SMA): 113.73 (bullish)
50-day SMA: 113.61 (bullish)
200-day SMA: 113.87 (bearish)
20-day Exponential Moving Average (EMA): 113.75 (bullish)
50-day EMA: 113.66 (bullish)
200-day EMA: 113.97 (bearish)
Moving Average Convergence Divergence (MACD): The MACD is positive, indicating bullish momentum.
Commodity Channel Index (CCI): The CCI is at 462.41, which is considered extremely overbought, suggesting potential for a pullback.
🔍 Support and Resistance Levels
Resistance: 117.24
Support: 111.4
Bài đăng liên quan
Thông báo miễn trừ trách nhiệm
Thông tin và các ấn phẩm này không nhằm mục đích, và không cấu thành, lời khuyên hoặc khuyến nghị về tài chính, đầu tư, giao dịch hay các loại khác do TradingView cung cấp hoặc xác nhận. Đọc thêm tại Điều khoản Sử dụng.
Bài đăng liên quan
Thông báo miễn trừ trách nhiệm
Thông tin và các ấn phẩm này không nhằm mục đích, và không cấu thành, lời khuyên hoặc khuyến nghị về tài chính, đầu tư, giao dịch hay các loại khác do TradingView cung cấp hoặc xác nhận. Đọc thêm tại Điều khoản Sử dụng.