🔎 Full Analysis
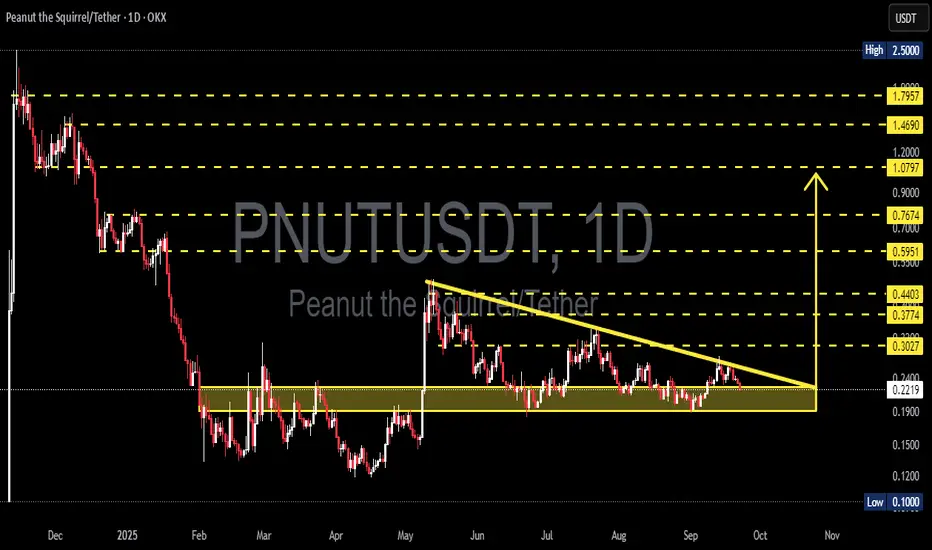
The PNU/USDT (1D) chart shows a clear Descending Triangle pattern that has been forming since May 2025. Price is currently trading around 0.2216 USDT, moving closer to the apex of the pattern — a sign that a big move is likely approaching.
⚙️ Pattern Details
Strong Support (Accumulation Zone): 0.19 – 0.24
This area has been tested multiple times and continues to attract buyers.
Descending Resistance: A downward sloping trendline from May’s high is pressing price lower, forming consecutive lower highs.
Characteristics: While this pattern is typically seen as a bearish continuation, it can also turn into an accumulation base if buyers step in with strong volume.
---
🚀 Bullish Scenario
Confirmation: Daily close above 0.3027 with strong volume.
Step-by-step targets:
First breakout level: 0.3027
Next targets: 0.3774 → 0.415 → 0.4403
Extended target if momentum accelerates: 0.5951
Measured Move Potential: A confirmed breakout projects a move toward 0.415 – 0.44 USDT.
Bullish Narrative: A breakout above the descending trendline could signal the start of a major reversal from long-term accumulation. Buyers regaining control may drive PNU/USDT back toward the 0.40 – 0.60 zone.
---
📉 Bearish Scenario
Confirmation: Daily close below 0.19 with high volume.
Step-by-step targets:
Conservative target: 0.10 USDT (chart low label)
Aggressive measured move target: 0.08 USDT
Bearish Narrative: If 0.19 fails as support, the descending triangle would act as a continuation pattern of the previous downtrend, potentially triggering a deeper breakdown toward 0.10 or even lower.
---
📌 Conclusion
PNU/USDT is at a critical decision point:
Bullish case: Breakout above the trendline could unlock a reversal and rally toward 0.40+.
Bearish case: Breakdown below 0.19 could extend the downtrend to 0.10 or lower.
With price approaching the apex, volatility is expected soon. Traders should wait for daily close + volume confirmation before committing to a position and apply strict risk management to avoid false breakouts.
---
⚡ Key Levels to Watch
Support zone: 0.19 – 0.24
Critical resistance: 0.3027
Breakout targets: 0.3774 → 0.415 → 0.4403 → 0.5951
Breakdown targets: 0.10 – 0.08
---
#PNUT #PNUTUSDT #PeanutTheSquirrel #TechnicalAnalysis #DescendingTriangle #CryptoAnalysis #Altcoin #Breakout #BearishOrBullish #CryptoTrading
✅ Get Free Signals! Join Our Telegram Channel Here: t.me/TheCryptoNuclear
✅ Twitter: twitter.com/crypto_nuclear
✅ Join Bybit : partner.bybit.com/b/nuclearvip
✅ Benefits : Lifetime Trading Fee Discount -50%
✅ Twitter: twitter.com/crypto_nuclear
✅ Join Bybit : partner.bybit.com/b/nuclearvip
✅ Benefits : Lifetime Trading Fee Discount -50%
Thông báo miễn trừ trách nhiệm
Thông tin và các ấn phẩm này không nhằm mục đích, và không cấu thành, lời khuyên hoặc khuyến nghị về tài chính, đầu tư, giao dịch hay các loại khác do TradingView cung cấp hoặc xác nhận. Đọc thêm tại Điều khoản Sử dụng.