step-by-step technical analysis of Poonawalla Fincorp Ltd (Weekly Chart) the same way:
🔎 1. Chart Pattern
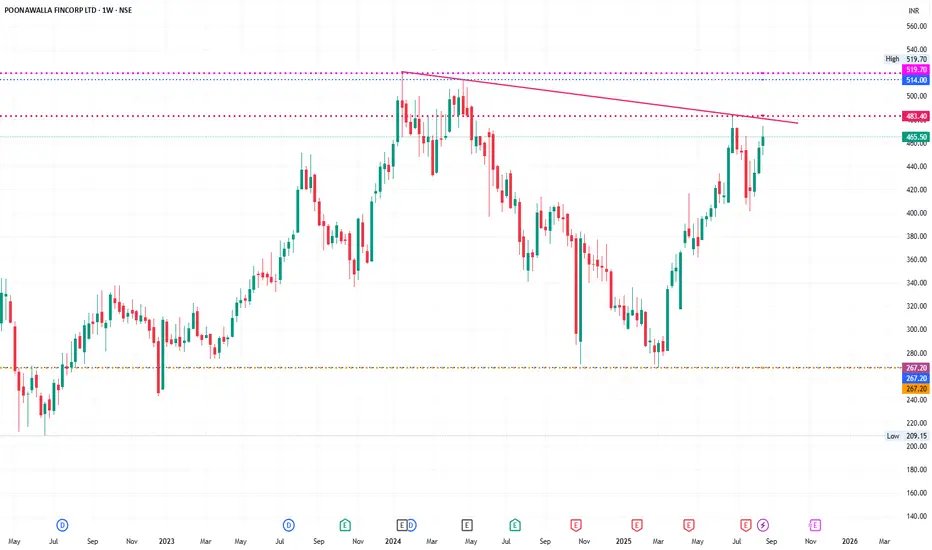
The stock is currently forming a Descending Triangle / Falling Trendline Resistance.
Price is approaching the trendline resistance (~₹480–485).
Breakout above ₹485–490 will confirm trend reversal.
If rejected, it may retrace back to lower supports.
🔎 2. Support & Resistance
Immediate Resistance: ₹483–490 (trendline + horizontal supply).
Next Resistance Levels: ₹514 → ₹520 (previous swing high).
Major Resistance: ₹550.
Immediate Support: ₹440 → ₹420 (recent consolidation).
Major Support Zone: ₹365 → ₹340.
Long-term Support: ₹267 (very strong base).
🔎 3. Candlestick / Price Action
The last few weekly candles show strong bullish momentum, higher highs, and higher lows.
But approaching a major supply zone (~₹480–490) → possible profit booking.
A weekly close above ₹490 with volume will confirm fresh breakout rally.
🔎 4. Indicators Perspective
RSI: Likely near 65–68 → bullish momentum but nearing overbought zone.
MACD: Positive crossover with rising histogram → bullish confirmation.
Volume: Increasing on recent up-move → accumulation happening.
Moving Averages:
Price trading above 20W & 50W EMAs → trend bullish.
If it sustains above ₹485, 200W EMA breakout likely confirms long-term uptrend.
🔎 5. Trend Outlook
Primary Trend (1–2 years): Bullish, provided stock sustains above ₹490.
Intermediate Trend (2–6 months): Neutral to bullish, watch for breakout.
Short Term (1–4 weeks): Testing resistance zone ₹480–490, may consolidate.
📌 Conclusion (Expert View)
✅ Stock is in strong uptrend but at a crucial resistance (₹483–490).
✅ Breakout above ₹490 can lead to targets ₹514 → ₹520 → ₹550.
✅ If rejected, stock can pull back to ₹440 → ₹420 zone (buying zone).
⚠️ Risk-Reward currently not very favorable until clear breakout.
👉 Strategy:
Traders: Wait for weekly close above ₹490 to enter fresh longs.
If already holding, book partial profit near ₹480–490, re-enter above ₹490 breakout.
Investors: Can accumulate on dips to ₹420–440 with SL ₹365
this is only for educational purpose not for suggestion
🔎 1. Chart Pattern
The stock is currently forming a Descending Triangle / Falling Trendline Resistance.
Price is approaching the trendline resistance (~₹480–485).
Breakout above ₹485–490 will confirm trend reversal.
If rejected, it may retrace back to lower supports.
🔎 2. Support & Resistance
Immediate Resistance: ₹483–490 (trendline + horizontal supply).
Next Resistance Levels: ₹514 → ₹520 (previous swing high).
Major Resistance: ₹550.
Immediate Support: ₹440 → ₹420 (recent consolidation).
Major Support Zone: ₹365 → ₹340.
Long-term Support: ₹267 (very strong base).
🔎 3. Candlestick / Price Action
The last few weekly candles show strong bullish momentum, higher highs, and higher lows.
But approaching a major supply zone (~₹480–490) → possible profit booking.
A weekly close above ₹490 with volume will confirm fresh breakout rally.
🔎 4. Indicators Perspective
RSI: Likely near 65–68 → bullish momentum but nearing overbought zone.
MACD: Positive crossover with rising histogram → bullish confirmation.
Volume: Increasing on recent up-move → accumulation happening.
Moving Averages:
Price trading above 20W & 50W EMAs → trend bullish.
If it sustains above ₹485, 200W EMA breakout likely confirms long-term uptrend.
🔎 5. Trend Outlook
Primary Trend (1–2 years): Bullish, provided stock sustains above ₹490.
Intermediate Trend (2–6 months): Neutral to bullish, watch for breakout.
Short Term (1–4 weeks): Testing resistance zone ₹480–490, may consolidate.
📌 Conclusion (Expert View)
✅ Stock is in strong uptrend but at a crucial resistance (₹483–490).
✅ Breakout above ₹490 can lead to targets ₹514 → ₹520 → ₹550.
✅ If rejected, stock can pull back to ₹440 → ₹420 zone (buying zone).
⚠️ Risk-Reward currently not very favorable until clear breakout.
👉 Strategy:
Traders: Wait for weekly close above ₹490 to enter fresh longs.
If already holding, book partial profit near ₹480–490, re-enter above ₹490 breakout.
Investors: Can accumulate on dips to ₹420–440 with SL ₹365
this is only for educational purpose not for suggestion
Thông báo miễn trừ trách nhiệm
Thông tin và ấn phẩm không có nghĩa là và không cấu thành, tài chính, đầu tư, kinh doanh, hoặc các loại lời khuyên hoặc khuyến nghị khác được cung cấp hoặc xác nhận bởi TradingView. Đọc thêm trong Điều khoản sử dụng.
Thông báo miễn trừ trách nhiệm
Thông tin và ấn phẩm không có nghĩa là và không cấu thành, tài chính, đầu tư, kinh doanh, hoặc các loại lời khuyên hoặc khuyến nghị khác được cung cấp hoặc xác nhận bởi TradingView. Đọc thêm trong Điều khoản sử dụng.